
Restaurant Cost of Goods Sold: The Month-End Inventory Count That Tells You Where the Money Went
Restaurant cost of goods sold (COGS) is more than a percentage on your profit-and-loss statement: it is the value of the food, beverages, and other inventory your restaurant actually consumed to generate sales. The number you calculate at month-end is only as reliable as the inventory count behind it, and a count skipped, rushed, or performed at the wrong time can make a profitable operation look unprofitable, or hide a real leak.
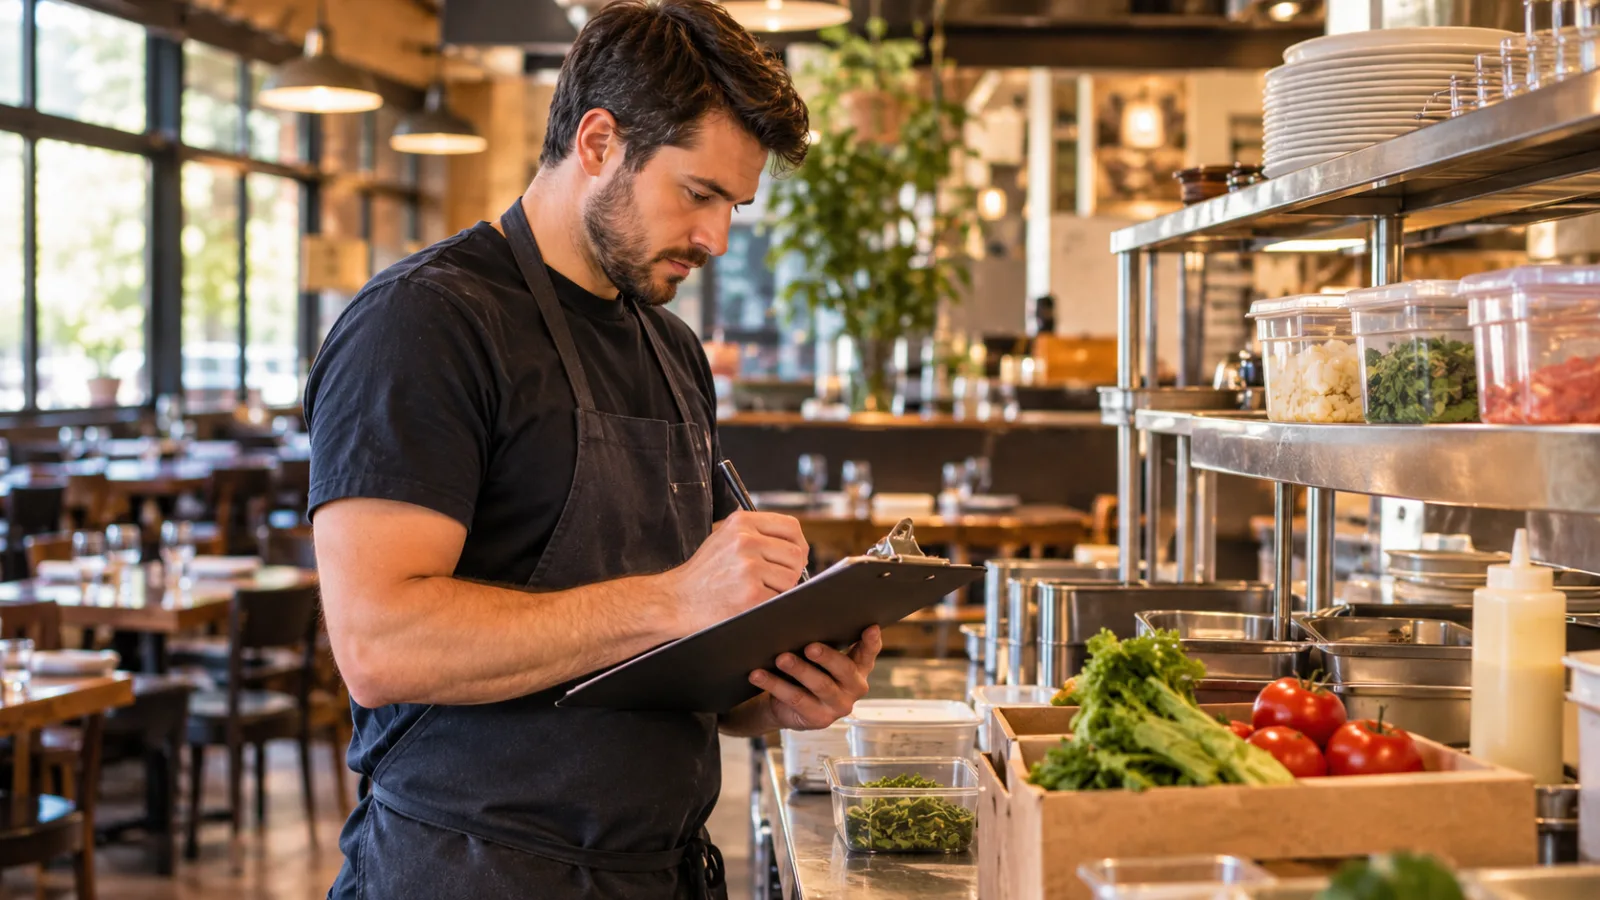
The COGS formula starts and ends with physical inventory
The basic formula is straightforward:
COGS = Beginning Inventory + Purchases − Ending Inventory
Each term has a specific job.
- Beginning inventory: The value of everything you had in stock at the start of the period.
- Purchases: The cost of inventory received during the period, adjusted for credits, returns, and the accounting treatment of freight or other costs.
- Ending inventory: The value of everything still in stock at the end of the period.
Beginning inventory is normally the previous period's ending inventory. Purchases come from invoices and receiving records, not simply the total amount paid to vendors during the month. Ending inventory comes from a physical count valued consistently with your inventory accounting method.
The formula measures what left your inventory during the period, whether it was sold, wasted, spoiled, used for staff meals, comped, over-portioned, or otherwise consumed. It does not automatically mean every dollar represents a sale.
That distinction is why the month-end count deserves attention. You can have accurate sales reports, carefully entered invoices, and a good recipe costing spreadsheet, and still have unreliable COGS if the closing inventory is wrong.
A month-end count can change the entire story
Imagine you close October, pull your invoices, and calculate purchases correctly. Your beginning inventory is accurate, too. The only problem is the closing count.
If the closing inventory is overstated, COGS appears lower because the formula subtracts a larger number. If ending inventory is understated, COGS appears higher because you are subtracting less.
The error doesn't necessarily mean food physically disappeared. It may mean your reporting period has the wrong amount of inventory assigned to it.
Here's what that looks like:
| Month-end count scenario | Ending inventory | Calculated COGS |
|---|---|---|
| Correct count | $7,100 | $20,500 |
| Count overstated by $1,000 | $8,100 | $19,500 |
| Count understated by $1,000 | $6,100 | $21,500 |
All figures in this table are hypothetical.
An inventory error of $1,000 changes reported COGS by exactly $1,000. If you use the incorrect number to make decisions about pricing, staffing, purchasing, or menu cuts, you may be responding to a problem that doesn't exist, or overlooking one that does.
What happens when you skip the count?
If you skip October's physical count and simply carry September's ending inventory forward, you haven't measured October's ending inventory. You've assumed it.
Suppose your stock actually fell from $8,200 to $7,100, but you carried forward the old $8,200 number. Your COGS calculation will be understated by $1,100.
That can create a misleading sense that your food costs improved, particularly if sales were strong. The inventory depletion happened, but the calculation didn't capture it.
If you skip counts repeatedly, the errors can compound through unreliable reporting, inconsistent adjustments, and bad purchasing decisions. A later correction may create a sudden jump in COGS that looks like a new operational problem even though some of it is simply a correction of past periods.
What happens when the count is rushed?
Rushed counts commonly miss open cases, walk-in shelves, freezer stock, bar storage, backup product, or items stored away from their normal location.
Other problems include counting a case as a full case when it is partially used, confusing ounces with pounds, entering a quantity into the wrong unit, and counting the same product twice.
A count sheet should describe the unit being counted. "Chicken breast, pounds" is much better than "chicken, cases" when you have opened packages and partial cases.
What happens when the count is done at the wrong time?
A count is a snapshot. Purchases, transfers, prep, sales, waste, and deliveries around that snapshot affect the accuracy of the period.
If your count begins at 10 p.m. on the last day of the month but a delivery arrives at 10:30 p.m. and gets stocked before the count reaches that shelf, you need to know whether that delivery belongs in the ending inventory and whether its invoice belongs in that month's purchases.
The problem is not that you can't count while the restaurant is operating. The problem is that movements across the cutoff must be recorded consistently.
Choose a cutoff procedure: stop movement in the counted area, record movements on a temporary sheet, or establish a clear rule for which transactions belong before and after the count. Apply the same procedure each month.
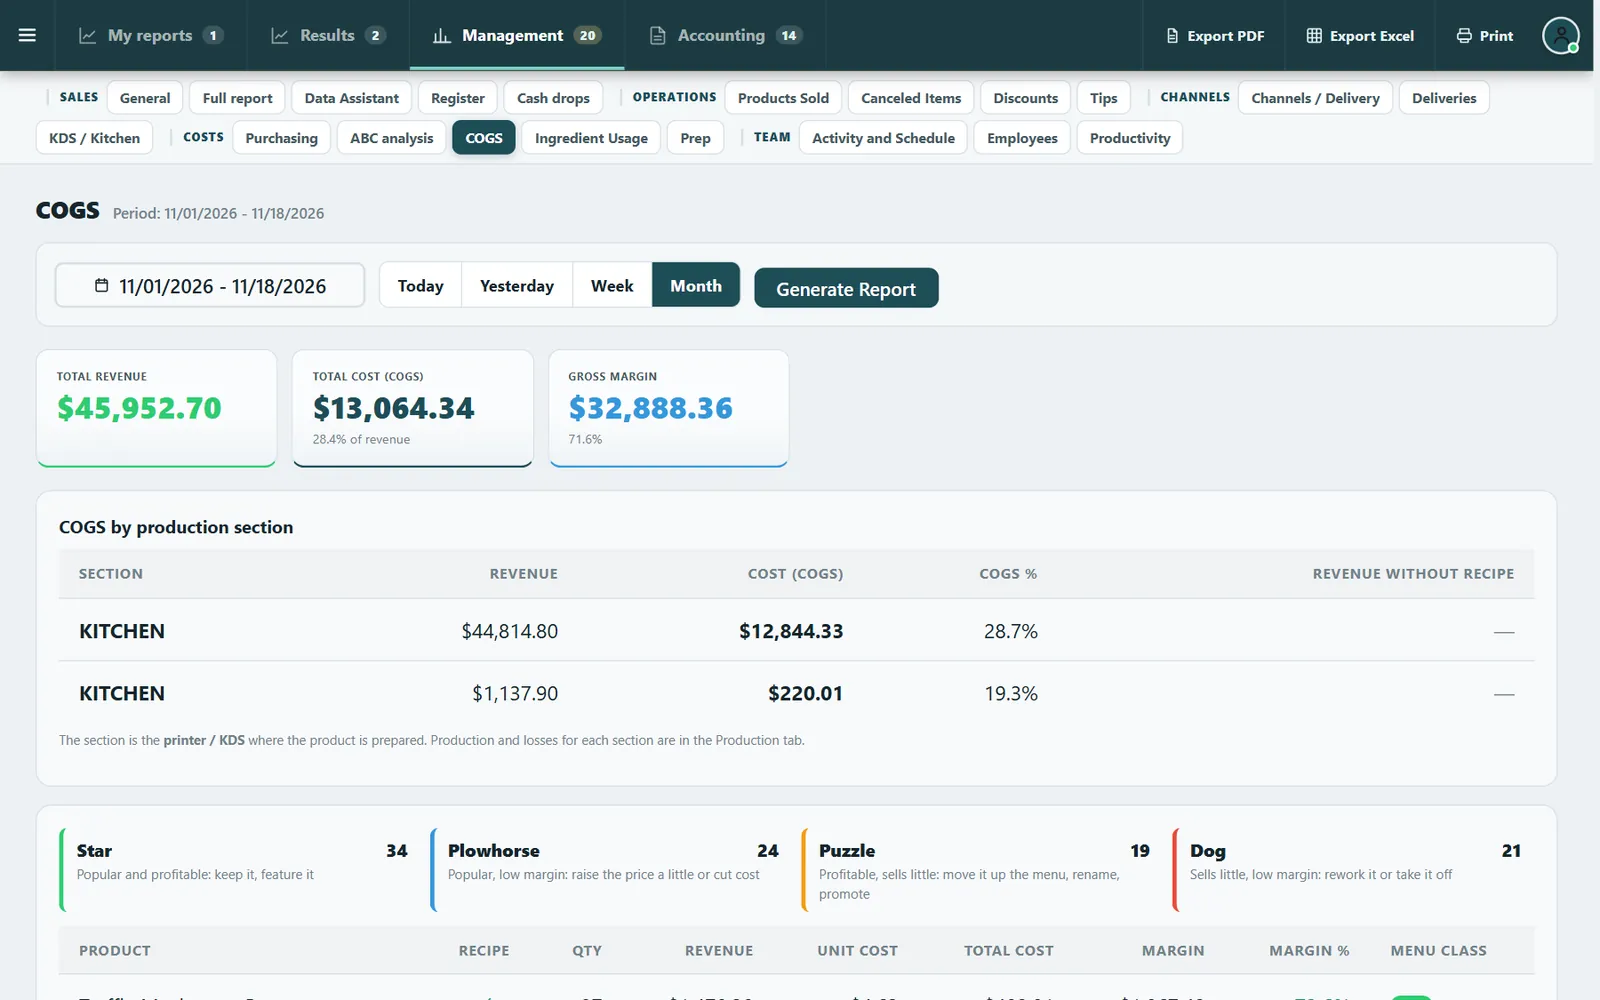
Separate food, beverage, and paper instead of relying on one blended number
A combined COGS figure is useful for understanding the overall operation, but it can conceal a problem in one department.
Food, beverage, and paper products have different purchasing patterns, storage locations, sales relationships, and controls. Calculate them separately.
Food COGS
Food COGS typically includes ingredients used in food sold, such as meat, seafood, produce, dairy, dry goods, cooking oil, sauces, and ingredients for desserts.
Depending on your accounting setup, you may separately track employee meals, waste, complimentary food, and other internal consumption. Those records help explain the difference between theoretical recipe cost and actual inventory depletion.
A useful food COGS calculation is:
Food COGS = Beginning Food Inventory + Food Purchases − Ending Food Inventory
Then calculate food cost percentage:
Food Cost % = Food COGS ÷ Food Sales × 100
Keep food sales separate from beverage sales if you're evaluating kitchen performance.
Beverage COGS
Beverage inventory should include the products you sell and use: bottled beverages, beer, wine, spirits, mixers, coffee, tea, and other drink ingredients.
Bar inventory is especially sensitive to measurement. A partial bottle of liquor can't be valued as a full bottle. Kegs, bag-in-box products, and syrups need a consistent measurement method.
Beverage COGS = Beginning Beverage Inventory + Beverage Purchases − Ending Beverage Inventory
Beverage Cost % = Beverage COGS ÷ Beverage Sales × 100
Keep categories separate when they behave differently. Beer, wine, liquor, and nonalcoholic beverages may have different purchasing patterns, margins, and controls.
Paper and packaging COGS
Paper products often get overlooked because they are purchased through a different vendor or stored outside the kitchen.
Include the items your restaurant consumes to fulfill sales, such as:
- Takeout containers and lids
- Napkins and paper towels
- Disposable cups and straws
- Bags and utensils
- Food wrapping and portion cups
Whether these items are classified as COGS, supplies, or another expense depends on your accounting policy. Be consistent and make sure your reporting includes the costs you intend to monitor.
Paper COGS = Beginning Paper Inventory + Paper Purchases − Ending Paper Inventory
If you sell a large amount of takeout, paper cost per takeout order may be more informative than paper cost as a percentage of total sales.
Work through the month-end calculation using hypothetical numbers
The following example represents one independent restaurant closing its books for a hypothetical month. Every amount, sales figure, inventory value, and percentage below is hypothetical.
| Category | Beginning inventory | Purchases | Ending inventory | COGS |
|---|---|---|---|---|
| Food | $8,200 | $19,400 | $7,100 | $20,500 |
| Beverage | $2,300 | $6,800 | $1,900 | $7,200 |
| Paper | $1,100 | $2,700 | $900 | $2,900 |
| Total | $11,600 | $28,900 | $9,900 | $30,600 |
All figures are hypothetical.
Food calculation:
$8,200 + $19,400 − $7,100 = $20,500
Beverage calculation:
$2,300 + $6,800 − $1,900 = $7,200
Paper calculation:
$1,100 + $2,700 − $900 = $2,900
The total inventory consumed across these three categories is $30,600.
Now add hypothetical sales:
| Category | Sales | COGS | Cost percentage |
|---|---|---|---|
| Food | $56,000 | $20,500 | 36.61% |
| Beverage | $18,000 | $7,200 | 40.00% |
| Paper | $12,000 in takeout sales | $2,900 | 24.17% of takeout sales |
| Combined | $86,000 food and beverage sales | $27,700 food and beverage COGS | 32.21% |
All figures are hypothetical. Paper is shown against takeout sales for illustration, not as a universal accounting convention.
Food cost percentage:
$20,500 ÷ $56,000 × 100 = 36.61%
Beverage cost percentage:
$7,200 ÷ $18,000 × 100 = 40.00%
Combined food and beverage cost percentage:
$27,700 ÷ $74,000 × 100 = 37.43%
The combined percentage is a weighted result of food and beverage sales, not an average of the two category percentages.
The owner now has three different conversations to investigate. Food may have a portioning, purchasing, waste, or pricing issue. Beverage may need a review of pours, comps, recipe quantities, or bottle counts. Paper may be unusually high relative to takeout volume, or the restaurant may be using more packaging per order than expected.
The calculation doesn't diagnose the problem by itself. It tells you where to investigate.
Use the inventory count to find the leaks your sales report cannot show
Actual COGS tells you what inventory was consumed. The next step is finding out why that consumption occurred.
Start with a few operational comparisons.
Compare actual usage with recipe usage
For each popular dish, calculate the expected ingredient usage from recorded sales and standardized recipes.
For example, if a hypothetical restaurant sold 100 burgers and each recipe calls for 6 ounces of beef, expected beef usage is 600 ounces, or 37.5 pounds.
If your inventory records show 45 pounds consumed, the difference is 7.5 pounds. That gap is worth investigating.
Possible causes include:
- Portions larger than the recipe
- Staff meals not recorded
- Incorrect sales quantities
- Waste or spoilage
- Prep mistakes
- Theft
- Incorrect inventory units
- Recipes that don't reflect actual production
The comparison is only useful if the recipe, sales mix, and inventory units are accurate. Don't accuse employees of theft based on a variance alone.
Investigate the products that move the most dollars
Not every item deserves the same counting effort.
A missing case of expensive seafood can matter more than several missing containers of inexpensive seasoning. Start with high-value proteins, liquor, specialty cheese, premium oils, and other expensive or easy-to-miscount products.
You can also prioritize products with frequent price changes, unusual waste, or recurring shortages.
Look at purchasing frequency alongside inventory depletion
If you keep ordering an ingredient before the previous order should have been consumed, investigate.
Repeated emergency orders may indicate poor forecasting, excessive waste, incorrect prep quantities, a missing par level, or unreliable receiving. They can also reveal a genuine sales increase.
Compare what you ordered, what you received, what you sold, and what remained. That sequence is more useful than looking at a vendor invoice in isolation.
Three practical inventory controls you can introduce this week
These don't require a major project or a new reporting system. They require consistency.
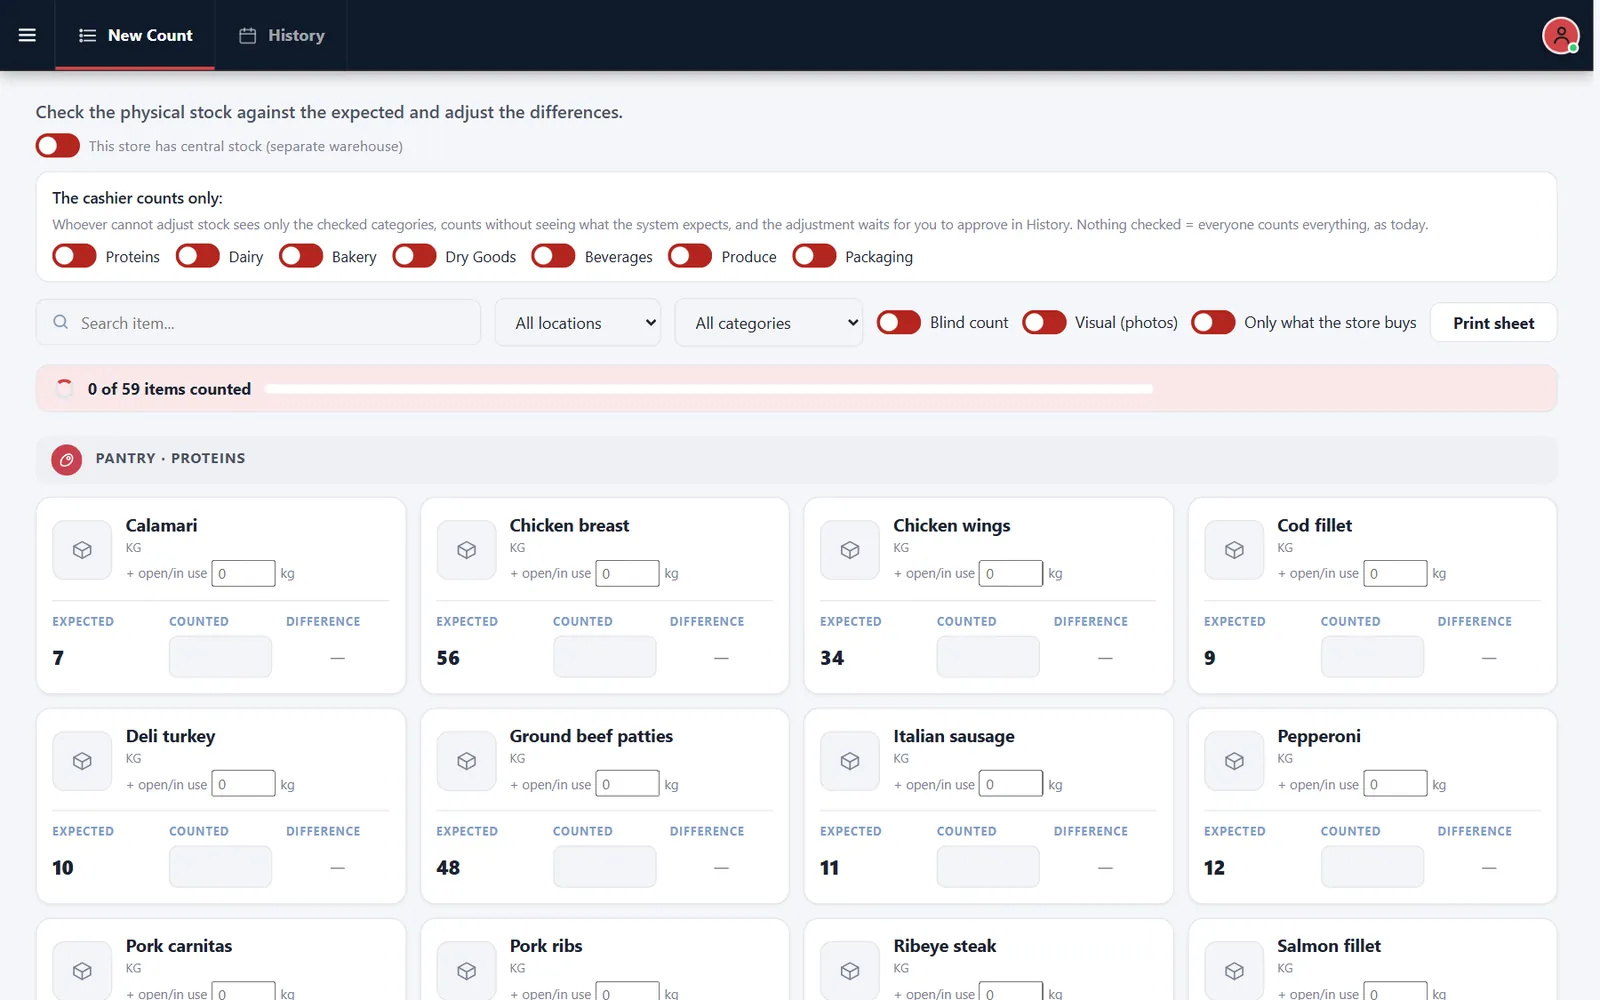
1. Run a blind count on your most expensive items
Choose a short list of high-value inventory items. Have the person counting record quantities before seeing the previous count or expected balance.
Compare the count with the recorded quantity afterward.
If the same items regularly have discrepancies, check how they're stored, measured, received, and used. A blind count helps prevent the previous number from influencing the new count.
Try this for a week on a small group of items rather than changing the entire inventory process overnight.
2. Put a receiving checkpoint between the delivery and the storage shelf
Assign someone to verify the invoice against the physical delivery before product is put away.
Check:
- Item and description
- Quantity received
- Weight or pack size
- Substitutions
- Damaged goods
- Missing products
- Price differences
Record discrepancies immediately. If a vendor invoice says you received a case of 12 but the delivery contains 10, correcting it while the driver or receiving paperwork is available is much easier than finding the difference at month-end.
3. Create a variance note instead of simply adjusting the number
When the count differs from expectations, don't immediately change the inventory balance and move on.
Record the discrepancy, the person reviewing it, the likely explanation, and any corrective action.
For example:
Ground beef variance: 8 pounds. Reviewed portion sizes and prep waste. Burger patties were being portioned above the recipe weight. Re-trained the prep team and added a scale to the station.
This turns a number into an operational change. The following week's count can help determine whether the fix worked.
Keep invoice prices current so COGS doesn't become a delayed warning
Inventory cost changes when supplier prices change. If your recipe costing still uses last month's price, your theoretical cost may be wrong even when the kitchen follows the recipe perfectly.
Review the invoices for your largest purchases every week. Update the cost per usable unit when the purchase price or pack size changes.
Pay attention to:
- Price increases on core proteins
- Different pack sizes
- Weight-based versus case-based pricing
- Substituted ingredients
- Vendor credits
- Freight or other charges included in your accounting policy
- Yield changes caused by product quality or trimming
A product that appears cheaper per case may be more expensive per usable pound after trimming, cooking loss, or waste.
Use a consistent unit of measurement. If you buy a case, prep in pounds, and portion in ounces, convert everything into the same usable unit before comparing costs.
Don't let paper and packaging become an invisible expense
Paper usage has a direct relationship with how the restaurant operates, especially when takeout volume grows.
Count packaging the same way you count food. Don't estimate by looking at a stack of containers. Track purchases, beginning stock, ending stock, and usage.
Then compare paper consumption with the orders that require it.
A few useful operating questions:
- Does every takeout order receive utensils even when the customer doesn't need them?
- Are staff using multiple bags when one would work?
- Are containers being discarded during prep because lids don't fit?
- Does the packaging station have the correct container sizes within reach?
- Are dine-in orders accidentally being packed in takeout containers?
- Are staff grabbing supplies from multiple locations without a clear restocking process?
If paper cost is rising while takeout sales remain flat, investigate packaging habits, waste, and product substitutions before blaming the vendor.
Make the month-end count repeatable with this ready-to-copy checklist
Use the same checklist every month. Assign responsibility to a person and have the manager review the completed count.
Month-end inventory closing checklist
Before counting
- Set the inventory cutoff time.
- Confirm all invoices and receiving records are collected.
- Record pending deliveries, credits, returns, and transfers.
- Organize the walk-in, freezer, dry storage, bar, and packaging areas.
- Prepare count sheets with item names and units.
- Assign count areas and reviewers.
During counting
- Count every storage location.
- Record partial cases and opened containers.
- Use the correct units of measure.
- Check expiration dates and damaged stock.
- Avoid duplicate counts.
- Record movement after the cutoff.
- Recount questionable or high-value items.
After counting
- Enter ending quantities.
- Value inventory consistently.
- Verify purchases and vendor credits.
- Calculate food, beverage, and paper COGS separately.
- Calculate category cost percentages.
- Compare against prior periods and expected usage.
- Investigate significant variances.
- Document adjustments and corrective actions.
- Approve and close the period.
Manager: ____________________
Count date: ____________________
Cutoff time: ____________________
Reviewer: ____________________
Variance notes: ____________________
The checklist should live where the closing manager can actually use it. A printed sheet in the office, a shared document, or an assigned closing task can all work. The important part is that the process doesn't depend on someone remembering every step.
Use inventory and recipe costing to connect COGS to the menu
Your inventory count tells you what was consumed. Recipe costing tells you what should have been consumed for the items sold.
Those two views should work together.
A recipe costing review should include the actual ingredient quantity, current purchase cost, usable yield, portion size, and all components served with the dish. Don't leave out garnishes, sauces, sides, cooking oil, or finishing ingredients because they seem small.
When a menu item's cost changes, decide whether the next move is a price adjustment, portion change, ingredient substitution, preparation improvement, or a menu redesign.
Avoid making changes based only on a single month. A count error, unusually large event, inventory buildup, or supplier credit can distort the result. Look for repeated patterns and confirm the underlying data before changing a menu customers already know.
Keep inventory, recipes, and sales connected in one operating workflow
Restaurant operators often maintain sales in one system, invoices in another, inventory on paper, and recipe costs in a spreadsheet. That can work, but it creates extra opportunities for mismatched quantities, stale prices, and forgotten updates.
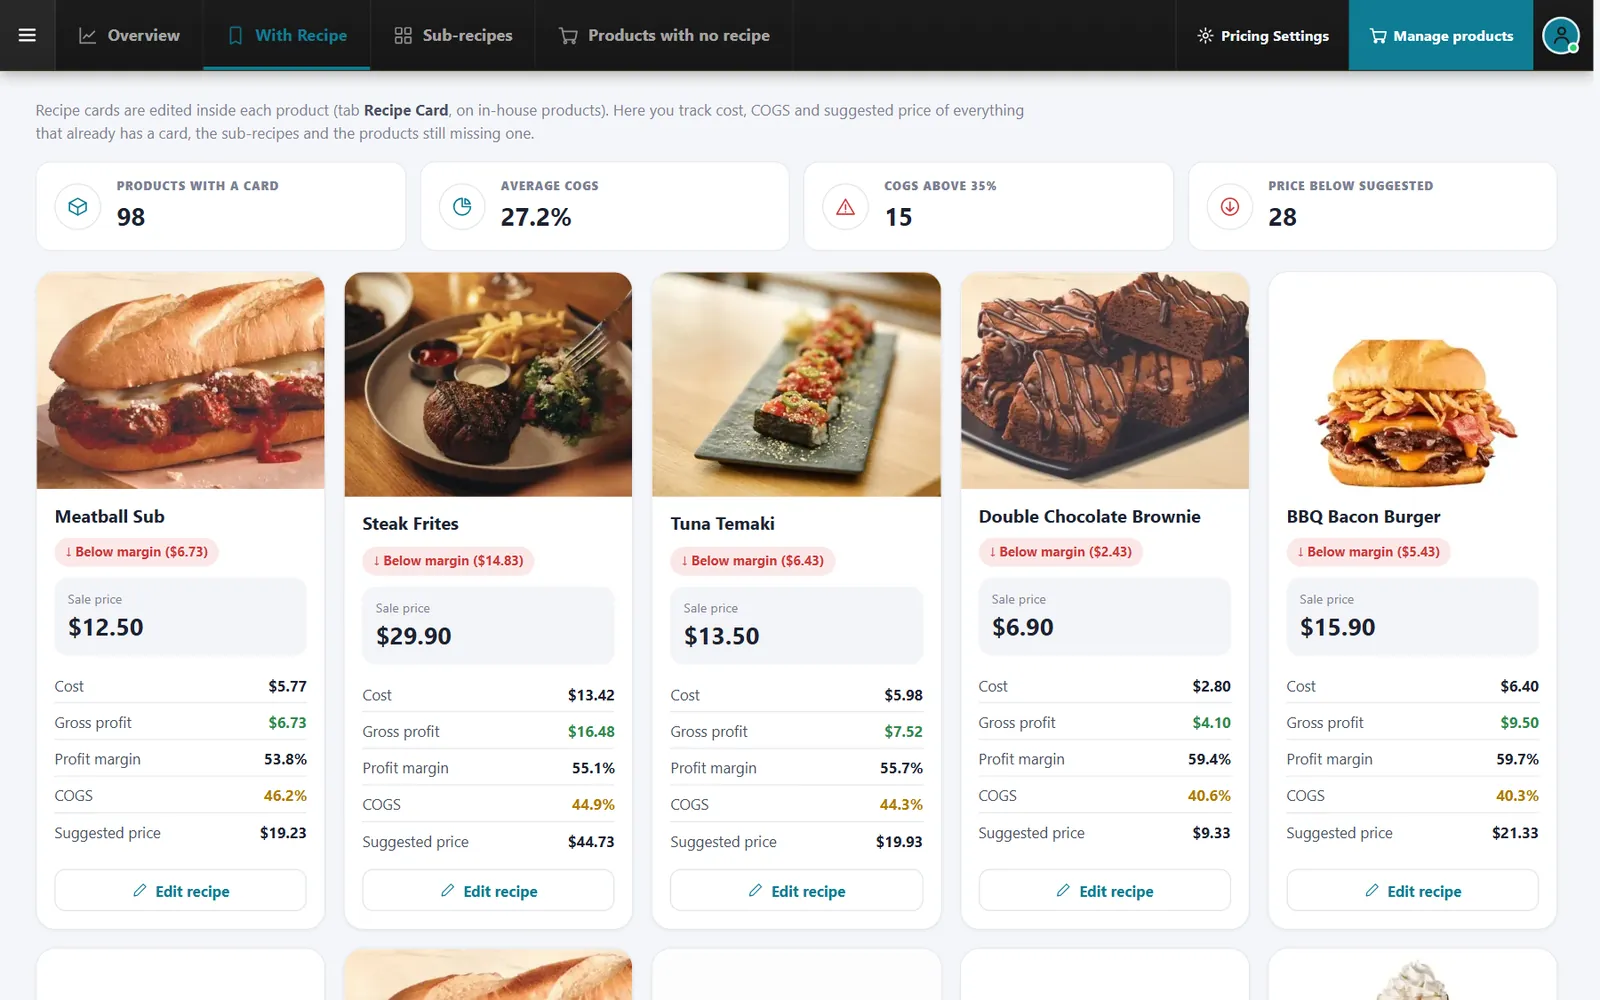
CounterChef runs on iPad, Android tablet, iPhone and computer; it includes inventory and recipe costing that show the cost of each dish, reports by day, item and employee, and a kitchen display with ticket timers. It also supports your own online menu for pickup and delivery, with delivery areas by ZIP code, each with its own fee and estimated time; a table map and server phones for dine-in; employee clock-ins on a tablet or computer and schedules built in the system; tip sharing by percentage or hours worked; loyalty points and gift cards; and sales tax rates with up to three decimals and by category.
Whatever tools you use, the operating discipline stays the same: count what you have, record what you buy, account for what you use, and investigate what doesn't reconcile.