
How to Calculate and Improve Bar Profit Margin: A Monthly Breakdown of Liquor, Beer, and Wine
Bar profit margin is not one number you can manage by looking at total beverage sales and subtracting the cost of everything you bought that month. Liquor, beer, and wine behave differently, so you need to track each category separately before bringing labor, rent, fees, and other operating expenses into the picture.
The goal is to know which part of the bar makes money, where margin disappears, and what you can change without damaging the guest experience.
Start by calculating bar profit margin by category
The first mistake operators make is treating every beverage as if it has the same cost structure. A bottle of domestic beer, a glass of house wine, and a cocktail made with three spirits have different purchasing costs, serving sizes, waste patterns, and selling prices.
Start with three separate categories:
- Liquor: spirits, cocktails, shots, and mixed drinks.
- Beer: draft beer, packaged beer, and specialty beer.
- Wine: wine by the glass, wine by the bottle, and wine-based drinks.
For each category, calculate pour cost:
Pour cost percentage = Beverage cost of goods sold ÷ Beverage sales × 100
If your liquor sales are $12,000 and the liquor used to generate those sales cost $3,000, your liquor pour cost is 25%.
That means you spent 25 cents on liquor for every dollar of liquor revenue.
The corresponding gross profit margin is:
Beverage gross profit margin = (Beverage sales − Beverage COGS) ÷ Beverage sales × 100
Using the same example:
- Liquor sales: $12,000
- Liquor COGS: $3,000
- Liquor gross profit: $9,000
- Liquor gross profit margin: 75%
Pour cost and gross profit margin are two ways of looking at the same relationship. A lower pour cost generally means a higher gross margin, assuming sales and cost classifications are accurate.
Neither figure tells you how much money the bar actually contributes to the restaurant after payroll, occupancy, utilities, and other expenses.
Calculate liquor, beer, and wine separately
Each category needs its own inventory count and cost calculation.
Liquor
Liquor requires particular attention because small measurement differences can accumulate across hundreds of drinks.
For every cocktail, document:
- Spirit and modifier quantities in ounces.
- Actual bottle cost.
- Garnish and mixer costs.
- Recipe yield.
- Selling price.
- Expected ingredient cost per drink.
For example, a hypothetical cocktail might use:
| Ingredient | Quantity | Hypothetical cost |
|---|---|---|
| Vodka | 1.5 oz | $0.90 |
| Orange liqueur | 0.5 oz | $0.40 |
| Lime juice | 0.75 oz | $0.20 |
| Simple syrup | 0.5 oz | $0.08 |
| Garnish | 1 piece | $0.12 |
| Total | $1.70 |
At a hypothetical menu price of $10, the drink has a $1.70 ingredient cost and a 17% theoretical pour cost.
Compare that theoretical number with actual inventory usage. If the actual cost is higher, investigate overpouring, unrecorded drinks, spillage, incorrect recipes, and inventory errors before changing the price.
Beer
Beer needs separate tracking for draft and packaged products.
For draft beer, account for the keg cost, usable ounces, serving size, and draft loss. A keg does not necessarily produce the exact number of saleable pints suggested by its theoretical volume.
Foam, line cleaning, overfilled glasses, and discarded beer all affect the actual result.
For packaged beer, track the cost per can or bottle and compare it with the menu price. Also watch for complimentary drinks, damaged packaging, and expired stock.
Wine
Wine has two different selling patterns: by the glass and by the bottle.
A bottle sold at the table has a relatively straightforward product cost. Wine sold by the glass introduces additional considerations, including serving size, oxidation, spoilage, and bottles that remain open too long.
For example, a hypothetical $15 bottle of wine with five saleable glasses produces a theoretical wine cost of $3 per glass.
At a hypothetical selling price of $9 per glass:
- Revenue from five glasses: $45
- Bottle cost: $15
- Gross profit: $30
- Pour cost: 33.3%
But if the bottle produces only four saleable glasses before the remaining wine is discarded, the actual cost per sold glass rises to $3.75.
That is why wine inventory procedures matter just as much as menu pricing.
Use actual inventory movement instead of relying on purchases
Your monthly beverage purchases are not the same as your monthly beverage consumption.
If you purchase $8,000 in liquor during November, that does not mean you used $8,000 of liquor in November. Some of that product may still be sitting on the shelves.
Calculate actual COGS using:
Beginning inventory + Purchases − Ending inventory = Actual COGS
For example, using hypothetical figures:
- Beginning inventory: $18,000
- Purchases: $7,500
- Ending inventory: $19,000
- Actual COGS: $6,500
The bar used $6,500 worth of product during the month.
Perform this calculation separately for liquor, beer, and wine. Use consistent inventory valuation methods and make sure transfers, complimentary drinks, and other product movements are recorded.
If the kitchen uses wine for cooking or liquor is transferred between locations, those movements must be documented. Otherwise, one department may appear to have poor margins simply because product costs are being assigned incorrectly.
Work through a complete hypothetical monthly bar profit statement
Here is a complete hypothetical example showing how category-level pour costs become an overall operating profit calculation.
Assume an independent restaurant operates a bar that sells cocktails, draft beer, packaged beer, wine by the glass, and bottles.
All figures below are hypothetical and are intended to demonstrate the calculation, not represent an industry benchmark.
Step 1: Calculate monthly sales and COGS
| Category | Sales | COGS | Pour cost | Gross profit |
|---|---|---|---|---|
| Liquor | $30,000 | $7,500 | 25% | $22,500 |
| Beer | $12,000 | $3,600 | 30% | $8,400 |
| Wine | $8,000 | $2,400 | 30% | $5,600 |
| Total | $50,000 | $13,500 | 27% | $36,500 |
The calculations are:
- Liquor: $7,500 ÷ $30,000 × 100 = 25%.
- Beer: $3,600 ÷ $12,000 × 100 = 30%.
- Wine: $2,400 ÷ $8,000 × 100 = 30%.
- Overall: $13,500 ÷ $50,000 × 100 = 27%.
The bar generates $36,500 in gross profit before operating expenses.
Notice that liquor contributes the largest dollar amount of gross profit. However, beer and wine have different sales volumes and cost structures, so they should not automatically receive the same management attention.
Step 2: Subtract monthly operating expenses
Now assume the restaurant allocates the following hypothetical expenses to its bar operation:
| Operating expense | Hypothetical monthly cost |
|---|---|
| Bar labor, including applicable employer costs | $10,000 |
| Payroll-related administrative expenses | $500 |
| Occupancy allocation | $4,000 |
| Utilities | $900 |
| Merchant processing fees | $1,200 |
| Cleaning and supplies | $450 |
| Repairs and maintenance | $350 |
| Marketing and promotions | $400 |
| Other operating expenses | $700 |
| Total operating expenses | $18,500 |
The bar's operating profit is:
$36,500 gross profit − $18,500 operating expenses = $18,000.
Its operating profit margin is:
$18,000 ÷ $50,000 × 100 = 36%.
The hypothetical monthly result looks like this:
| Financial measure | Amount |
|---|---|
| Total beverage sales | $50,000 |
| Total beverage COGS | ($13,500) |
| Beverage gross profit | $36,500 |
| Bar operating expenses | ($18,500) |
| Bar operating profit | $18,000 |
| Operating profit margin | 36% |
This is a simplified departmental operating statement. It excludes any costs not listed, such as taxes, interest, depreciation, or corporate overhead. If you want to measure the bar's fully loaded contribution, include the appropriate allocated expenses and use a consistent accounting method.
The important distinction is that a 73% beverage gross margin does not automatically mean the bar keeps 73% of its revenue.
Find the five places where bar profit usually disappears
Once you have category-level numbers, investigate the causes of the difference between theoretical and actual costs.
1. Overpouring
A bartender who consistently pours an extra quarter ounce may create a meaningful monthly cost.
Use measured pours during training and occasional shift checks. Make sure staff understand the approved recipe and serving size.
Do not assume every difference is misconduct. Poor equipment, inconsistent training, and unclear recipes can produce the same result.
2. Unrecorded complimentary drinks
A manager may authorize a round for a regular customer, a replacement drink after a mistake, or a promotional cocktail.
These decisions have a product cost. If they are not recorded, your inventory numbers will show unexplained usage.
Create separate POS categories for approved comps, promotional drinks, and remakes. Review them weekly.
3. Draft beer loss
A keg may lose saleable volume through foam, incorrect pouring technique, line issues, and cleaning procedures.
Record discarded beer rather than treating it as invisible waste. Track losses by product and shift where practical.
4. Wine spoilage
Open bottles that sit too long can quietly consume margin.
Establish opening dates, storage procedures, and a clear policy for when wine should no longer be served. Review open-bottle inventory at closing.
5. Purchasing and inventory errors
Incorrect invoice entries, missed transfers, inconsistent bottle counts, and unrecorded breakage can make a category appear more expensive than it really is.
Reconcile invoices against received quantities and investigate unexpected changes before assuming the problem is operational.
Improve margin without simply raising every menu price
Increasing prices can help, but it is not the only option. Sometimes the better decision is to change a recipe, serving procedure, purchasing pattern, or menu placement.
Try these practical operating changes.
Run a one-week pour calibration exercise.
Pick five high-volume cocktails. Have each bartender make the drinks using the normal service routine, then measure the actual pours during a controlled training exercise.
Compare the results with the recipe.
If one cocktail consistently exceeds its specification, retrain the team and check whether the jiggers or measuring equipment are appropriate.
Create a bottle-to-glass conversion check for wine.
Choose three wines sold by the glass. Record the bottle cost, intended number of servings, actual glasses sold, and any wine discarded.
At the end of the week, compare expected and actual yield.
This reveals whether your wine problem is pricing, serving size, or spoilage.
Give slow-moving inventory a physical shelf location.
Place slower-moving bottles in clearly designated sections rather than allowing them to disappear behind high-volume products.
Review these products before placing the next order. Consider whether they need a different menu position, a staff recommendation, a smaller order quantity, or removal from the list.
Schedule inventory counts around operational changes.
A new bartender, new cocktail menu, special event, or change in draft equipment can affect product usage.
Instead of waiting for the monthly count, conduct a focused count before and after the change. This helps you identify whether the change created additional waste or improved consistency.
Compare contribution dollars, not just percentages.
A drink with a 20% pour cost is not automatically more valuable than one with a 30% pour cost.
A hypothetical $8 cocktail with a $1.60 ingredient cost generates $6.40 in gross profit. A hypothetical $14 cocktail with a $4.20 ingredient cost generates $9.80.
The second drink has a higher pour cost but produces more gross profit dollars per sale.
Consider both contribution per drink and sales volume when deciding which products deserve attention.
Use this weekly bar margin checklist
You do not need a complicated reporting process to start managing beverage costs. A consistent weekly routine is more useful than a sophisticated spreadsheet nobody updates.
Copy this checklist into your weekly management notes.
| Weekly task | What to check | Complete |
|---|---|---|
| Review sales | Liquor, beer, and wine revenue separately | ☐ |
| Review purchases | Match invoices with received quantities | ☐ |
| Count priority inventory | High-value and high-volume products | ☐ |
| Check cocktail recipes | Compare measured pours with specifications | ☐ |
| Review draft loss | Record foam, spills, and discarded beer | ☐ |
| Review open wine | Check dates, storage, and spoilage | ☐ |
| Review comps | Identify complimentary drinks and remakes | ☐ |
| Check labor | Compare scheduled and actual bar hours | ☐ |
| Review exceptions | Investigate unusual cost changes | ☐ |
| Assign actions | Give each problem an owner and deadline | ☐ |
Keep the process short enough that managers can complete it during normal operations.
A useful addition is an exception log with four columns:
| Date | Problem | Estimated cost | Corrective action |
|---|---|---|---|
| Monday | Draft beer foam loss | $18 | Retrain opening bartender |
| Wednesday | Wine bottle discarded | $24 | Review opening procedure |
| Friday | Cocktail overpour | $15 | Recheck recipe training |
These are hypothetical entries. The point is to connect a financial variance to a specific operational action.
Use menu performance to decide what deserves attention
Once your category margins are under control, examine individual item performance.
A cocktail might sell frequently but produce relatively little gross profit per serving. Another might have excellent contribution but sell only occasionally.
You need both pieces of information.
A practical menu review considers:
- Sales volume.
- Recipe cost.
- Selling price.
- Gross profit per serving.
- Preparation time.
- Ingredient overlap with other menu items.
- Waste and storage requirements.
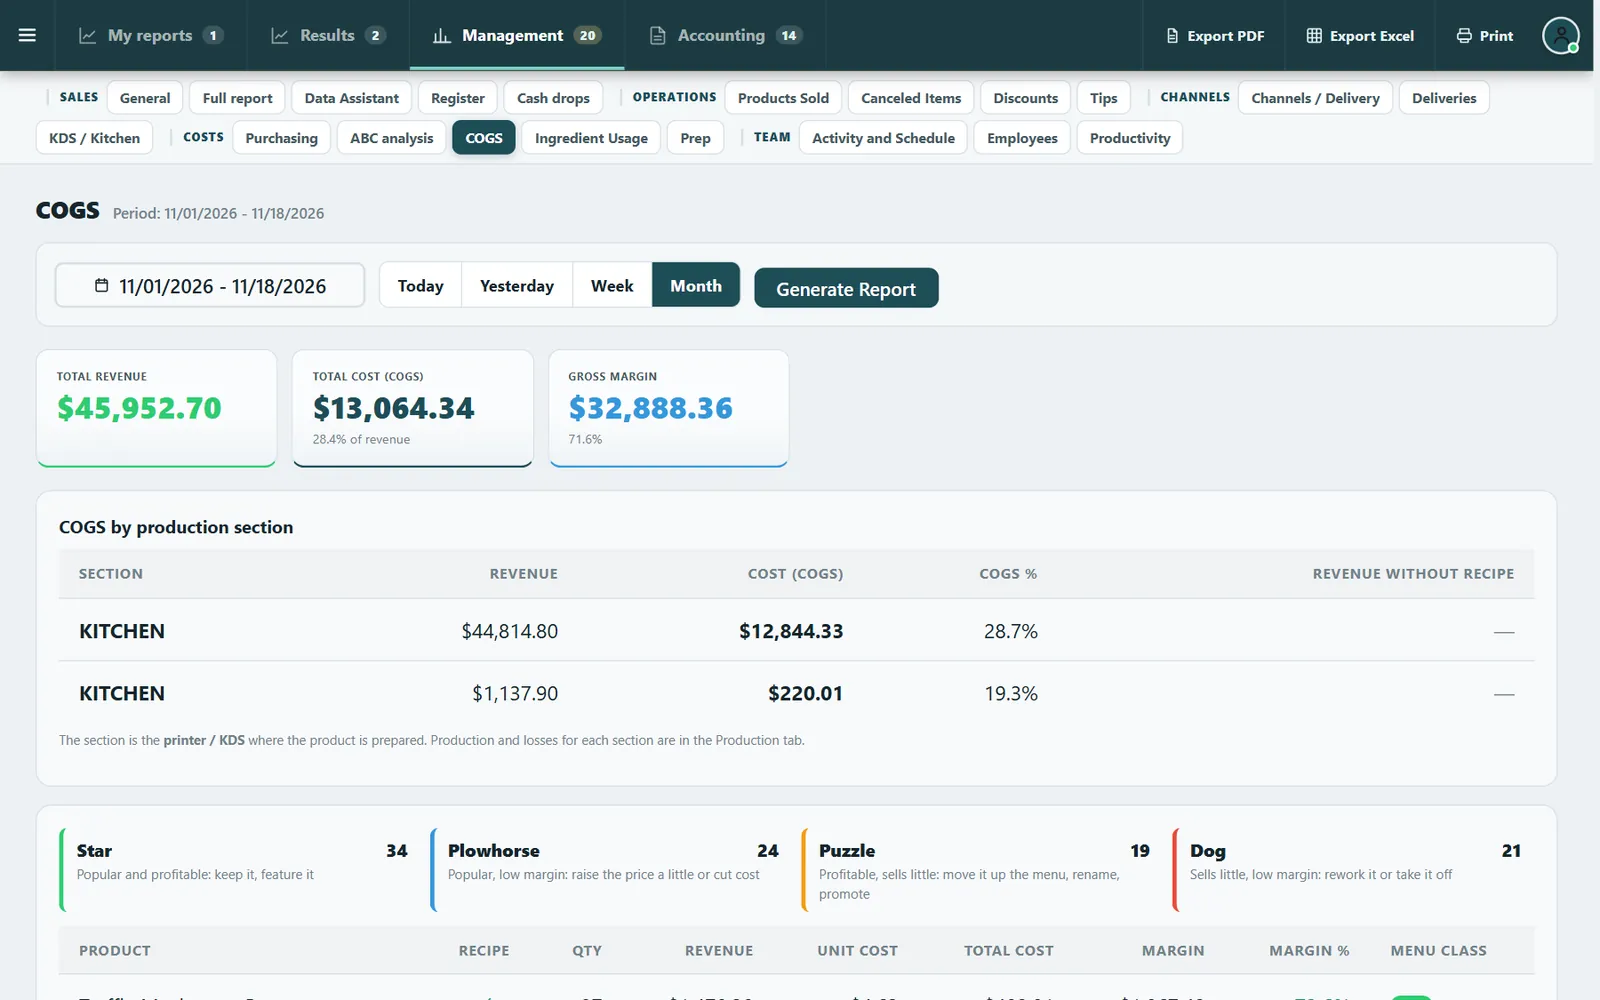
CounterChef's COGS report classifies every item as Star, Plowhorse, Puzzle or Dog using your own sales and recipe costs.
Use that classification as one input into your menu review, alongside actual inventory results and what your staff can execute consistently.
Do not remove an item simply because it has a weaker margin percentage. Consider its contribution dollars, its role in the menu, and whether changing the recipe or price would improve its performance.
Review bar profitability every month, not just when costs rise
A monthly review should answer five questions:
- Did liquor, beer, and wine sales change?
- Did actual COGS move differently from sales?
- Which category had the largest unfavorable variance?
- Did labor and other operating expenses increase?
- What specific operational change will we make next month?
Set a deadline for each corrective action and identify the manager responsible.
If liquor costs increased, for example, do not simply tell bartenders to pour less. Check recipe compliance, inventory movements, comps, and invoice accuracy first.
If wine costs increased, investigate spoilage and glass yields before changing the entire wine list.
If labor increased, compare staffing hours against actual sales patterns. Look for overlapping shifts, unnecessary early clock-ins, and closing procedures that take longer than they should.
Any changes to scheduling, wages, tips, overtime, or employee policies should comply with applicable federal, state, and local requirements. Confirm specific rules with the appropriate state or city agency or a qualified professional.
Frequently asked questions
What is a good bar profit margin?
There is no single appropriate margin for every bar. Results vary by concept, beverage mix, location, labor model, occupancy costs, and accounting treatment.
As a rule of thumb, operators sometimes compare pour costs and gross margins with businesses that have a similar concept, but those ranges vary by concept and should not be treated as universal targets.
Start by establishing your own monthly baseline and improving it without sacrificing service or product quality.
What is the difference between bar pour cost and bar profit margin?
Pour cost measures beverage product costs as a percentage of beverage sales.
Gross profit margin measures the percentage of sales remaining after beverage COGS.
Operating profit margin goes further by subtracting the operating expenses included in your departmental statement.
These measures answer different questions and should not be used interchangeably.
Should liquor, beer, and wine have the same pour cost target?
Not necessarily. Each category has different purchasing costs, serving sizes, spoilage risks, and sales patterns.
Set separate targets based on your recipes, actual purchasing costs, and historical results. Review each category independently before calculating the combined beverage result.
How often should I calculate bar profit margin?
Review sales, comps, and operating exceptions weekly. Complete a full inventory reconciliation and category-level COGS calculation monthly.
Weekly checks help you catch problems before they become expensive. Monthly reporting shows whether your corrective actions actually improved profitability.
The most useful bar profit margin report is one that leads to a specific decision: change a recipe, retrain a bartender, adjust a purchase, reduce waste, or revise a menu item. Track those decisions alongside the numbers, and your monthly report becomes an operating tool rather than another accounting exercise.
Related feature: COGS and menu engineering.