
How to Do Bar Inventory: A Practical Guide to Counting Bottles, Measuring Usage, and Finding Variance
Bar inventory is not just a matter of counting bottles at the end of the month. It is a way to understand what your bar actually used, what it should have used based on sales, and where the difference came from. If you run an independent restaurant, a consistent counting method can help you catch overpouring, recording errors, unexpected waste, and purchasing problems before they become expensive habits.
Start with a consistent bar inventory counting method
The first rule of bar inventory is to count the same way every time. If one manager estimates bottles by eye, another weighs them, and a third counts only full bottles, your inventory records will not be comparable.
Choose a method that your team can repeat accurately without slowing down the operation.
For most independent restaurants, a practical approach is to count bottles by location, record full bottles separately, and estimate partial bottles in tenths.
Organize the count by physical storage area:
- Main bar well and back bar
- Under-counter refrigerators
- Liquor storage room
- Beer cooler
- Wine storage
- Backup stock and locked storage
- Secondary service stations
Count each location separately before combining the totals. This helps identify misplaced stock and makes it easier to investigate differences.
Use a consistent counting sequence. For example, start at the left side of the main bar, work across the shelves, then move to the storage room. Avoid jumping between locations.
Assign one person to lead the count and another to verify unusual quantities. Ideally, the person counting should not be distracted by serving guests, receiving deliveries, or handling other closing duties.
Also establish a cutoff time. Inventory should represent a defined moment, such as immediately after closing on Sunday. Record deliveries, transfers, and sales around that cutoff carefully so the same stock is not counted twice or omitted.
Measure partial bottles in tenths instead of guessing
Partial bottles are where inventory accuracy often falls apart.
A bottle that looks half full might actually contain 40% or 60% of its original contents. That difference matters when you are tracking expensive spirits.
Use tenths of a bottle as your standard measurement.
A simple recording scale looks like this:
| Bottle condition | Inventory value |
|---|---|
| Full bottle | 1.0 |
| Approximately 90% full | 0.9 |
| Approximately 80% full | 0.8 |
| Approximately 70% full | 0.7 |
| Approximately 60% full | 0.6 |
| Approximately half full | 0.5 |
| Approximately 40% full | 0.4 |
| Approximately 30% full | 0.3 |
| Approximately 20% full | 0.2 |
| Approximately 10% full | 0.1 |
| Empty bottle | 0.0 |
For example, two full bottles and one bottle that is approximately 60% full equal 2.6 bottles.
Train employees to use the same visual reference when estimating partial bottles. If possible, use marked measuring bottles or a calibrated reference bottle during training.
For expensive spirits, consider measuring the remaining liquid with a graduated container or using a consistent bottle-weighing procedure. Weighing requires knowing the empty bottle's weight and accounting for differences in bottle design. Do not compare the weight of two different bottle types as though they were identical.
A useful exercise this week is to have two employees independently estimate the same ten partial bottles. Compare their results. Discuss the bottles with the largest differences and establish a shared visual standard.
This small exercise can reveal whether your team needs better training before you start relying on the numbers.
Build an inventory sheet around products and locations
Your inventory sheet should make counting straightforward. Avoid making employees search through a long alphabetical list while standing in a crowded storage room.
Organize products by category and storage location.
A useful structure includes:
| Product | Location | Bottle size | Full bottles | Partial bottles | Total |
|---|---|---|---|---|---|
| Vodka A | Main bar | 750 ml | 3 | 0.6 | 3.6 |
| Bourbon A | Liquor room | 750 ml | 4 | 0.3 | 4.3 |
| Gin A | Main bar | 750 ml | 2 | 0.8 | 2.8 |
| Rum A | Back bar | 750 ml | 2 | 0.5 | 2.5 |
All products and quantities in this table are hypothetical.
Include the following information in your actual inventory records:
- Product name and brand
- Bottle size
- Storage location
- Full bottle quantity
- Partial bottle quantity
- Total bottle-equivalent quantity
- Unit purchase cost
- Extended inventory value
- Count date and employee initials
Keep different bottle sizes as separate inventory items. A 750 ml bottle and a 1-liter bottle should not be treated as interchangeable units.
For financial reporting, convert the quantity into a consistent measurement when necessary. For example, 2.0 bottles of 1-liter vodka represent 2 liters, while 2.0 bottles of 750 ml vodka represent 1.5 liters.
Do not combine products just because they belong to the same category. Different brands and sizes have different purchase costs and may have different selling prices.
Calculate inventory value using actual purchase costs
Once you have counted the bottles, calculate their value.
The basic formula is:
Inventory value = Quantity on hand × Cost per bottle
For example:
- Product: Hypothetical bourbon
- Quantity: 4.3 bottles
- Cost per bottle: $28.00
- Inventory value: 4.3 × $28.00 = $120.40
Your inventory sheet should use the appropriate purchase cost for each product. If costs change between deliveries, establish a consistent accounting method with your bookkeeper or accountant.
For operational tracking, using a consistent cost basis makes comparisons between inventory periods more useful.
Remember that inventory value is not the same as cash available. The bottles represent stock purchased by the business, and their value should be considered alongside sales, purchasing, and operating expenses.
Calculate actual usage with the beginning and ending inventory formula
The most useful part of bar inventory is understanding how much product was consumed during a particular period.
To calculate actual usage, use this formula:
Actual usage = Beginning inventory + Purchases + Transfers in − Transfers out − Ending inventory
This formula gives you the quantity of product used during the period.
Suppose your restaurant begins the week with 12 bottles of a particular vodka. You purchase 4 more bottles, transfer 1 bottle to another location, and finish the week with 9 bottles.
Your calculation is:
- Beginning inventory: 12 bottles
- Purchases: 4 bottles
- Transfers out: 1 bottle
- Ending inventory: 9 bottles
- Actual usage: 12 + 4 − 1 − 9 = 6 bottles
The restaurant used 6 bottles during the period.
Record complimentary drinks, spills, breakage, staff drinks, and other authorized consumption separately when possible. These activities may explain some of the usage, but they should not disappear from your records.
If you transfer stock between locations within the same business, record the movement. Otherwise, a location-level inventory report can show misleading usage.
Compare actual usage with theoretical usage from sales
Actual usage tells you how much product disappeared from inventory. Theoretical usage tells you how much should have been used based on recorded sales and standard recipes.
This comparison is essential because the two numbers will not always match.
Use the following formula:
Theoretical usage = Number of drinks sold × Standard quantity per drink
For example, assume your restaurant sells 80 hypothetical bourbon cocktails during one week. Each recipe calls for a hypothetical 1.5-ounce pour.
Theoretical usage is:
- Drinks sold: 80
- Standard pour: 1.5 ounces
- Total theoretical usage: 80 × 1.5 = 120 ounces
If the bottle size is 750 ml, its approximate liquid capacity is 25.36 US fluid ounces.
Therefore:
- Theoretical usage: 120 ounces
- Bottle capacity: 25.36 ounces
- Theoretical bottle usage: 120 ÷ 25.36 = 4.73 bottles
Your sales records indicate that approximately 4.73 bottles should have been used.
Compare that number with actual inventory usage.
For a useful comparison, make sure your sales report and inventory period cover exactly the same dates and that the recipe quantities reflect what employees are instructed to pour.
Account for cocktails that contain multiple spirits, modifiers, substitutions, and different serving sizes. Otherwise, theoretical usage will be incomplete.
Find inventory variance with one worked spirit example
Variance is the difference between actual usage and theoretical usage.
The formula is:
Variance = Actual usage − Theoretical usage
A positive result means more product was used than sales and standard recipes would suggest. A negative result means less product was used than expected.
Here is a complete hypothetical example using bourbon.
All figures below are hypothetical and are provided for illustration only.
| Item | Hypothetical figure |
|---|---|
| Beginning inventory | 10.0 bottles |
| Purchases | 5.0 bottles |
| Transfers out | 0.0 bottles |
| Transfers in | 0.0 bottles |
| Ending inventory | 9.0 bottles |
| Actual usage | 6.0 bottles |
| Bottle size | 750 ml |
| Bottle capacity | 25.36 fl oz |
| Drinks sold | 80 |
| Standard pour | 1.5 fl oz |
| Theoretical usage | 4.73 bottles |
| Purchase cost per bottle | $24.00 |
First, calculate actual usage:
10.0 + 5.0 − 0.0 − 0.0 − 9.0 = 6.0 bottles.
Next, calculate theoretical usage:
80 × 1.5 = 120 ounces.
120 ÷ 25.36 = 4.73 bottles.
Now calculate the variance:
6.00 − 4.73 = 1.27 bottles.
The restaurant used approximately 1.27 more bottles than expected.
Convert that difference into a hypothetical dollar value:
1.27 × $24.00 = $30.48.
<PRIVATE_PERSON> In this hypothetical example, the bourbon usage variance represents $30.48 in additional product consumption compared with the recipe-based expectation.
That does not automatically mean someone stole liquor. It means the restaurant needs to investigate why actual usage exceeded theoretical usage.
Possible explanations include overpouring, unrecorded complimentary drinks, spills, incorrect recipes, inaccurate counts, missing sales entries, or an unrecorded transfer.
The point of variance analysis is to identify the cause, not assign blame.
Investigate variance in a fixed order before changing anything
When a product shows unexpected variance, resist the temptation to immediately confront the bartender or change the inventory number.
Start with the records.
Use this investigation sequence:
- Check the count. Have another employee recount the product, including backup bottles and partial bottles.
- Check deliveries. Compare purchase records with invoices and receiving notes.
- Check transfers. Look for bottles moved between the main bar, storage, and other service areas.
- Check sales. Confirm that every drink was entered correctly and that voids, comps, and discounts were handled properly.
- Check recipes. Verify that the standard pour and cocktail specifications are current.
- Check waste records. Review spills, breakage, remakes, and authorized staff drinks.
- Observe service. Watch how drinks are actually prepared during a normal shift.
Document what you find.
If the discrepancy continues, investigate the specific product and shift rather than making broad accusations about the entire bar team.
A useful practice is to keep a variance log with the product, date, quantity, dollar value, possible explanation, person investigating, and final resolution.
This turns an isolated discrepancy into operational information you can use.
Use three practical tests to improve accuracy this week
A good inventory process should change how the bar operates, not simply produce another spreadsheet.
Try these three exercises.
1. Run a partial-bottle agreement test.
Choose ten open bottles. Ask two employees to estimate each bottle independently in tenths. Compare the results and discuss the largest disagreements. Create a shared reference using the bottles your team actually handles.
2. Track one high-volume spirit by shift.
Select one spirit used frequently in cocktails. Record its opening quantity, deliveries, transfers, and closing quantity for each shift over several days. Compare the results with recorded drink sales.
This can help you identify whether a variance appears consistently or is concentrated in a particular service period.
3. Introduce a transfer ticket.
Whenever a bottle moves from the liquor room to the bar or between service stations, record the product, quantity, origin, destination, date, and employee initials.
This takes little time but prevents location-level inventory records from becoming unreliable.
One additional idea is to photograph unusually difficult partial bottles during training. Use those examples as an internal reference for future counts, rather than relying on everyone's memory.
Use this ready-to-copy checklist for every inventory count
Keep the following checklist with your inventory sheet. Have the person leading the count complete it before submitting the numbers.
BAR INVENTORY COUNT CHECKLIST
- Confirm the inventory cutoff date and time.
- Confirm that all recent deliveries have been recorded.
- Check that transfers are documented.
- Count the main bar and back bar separately.
- Count refrigerated products and backup storage.
- Record full bottles as whole units.
- Estimate partial bottles in tenths.
- Verify expensive or unusually low-stock products.
- Separate different bottle sizes and brands.
- Record authorized waste and breakage.
- Check that no storage location has been skipped.
- Calculate total quantity for each product.
- Calculate inventory value using purchase costs.
- Compare actual usage with theoretical usage.
- Flag unexpected differences for investigation.
- Record the names or initials of the employees completing the count.
Keep completed checklists with the corresponding inventory reports. Reviewing several periods together can help you identify recurring counting mistakes and operational problems.
Make inventory adjustments only after reviewing differences
A common mistake is changing the recorded inventory quantity as soon as a discrepancy appears.
That makes the spreadsheet look correct without explaining what happened.
Instead, preserve the original count, document the discrepancy, investigate it, and record any approved adjustment separately.
This distinction matters because an adjustment is a change to the record, not an explanation for the difference.
If you find that a bottle was stored in the wrong location, correct the location record. If a delivery was omitted, reconcile the receiving documentation. If a count was incorrect, retain the original entry and document the corrected quantity.
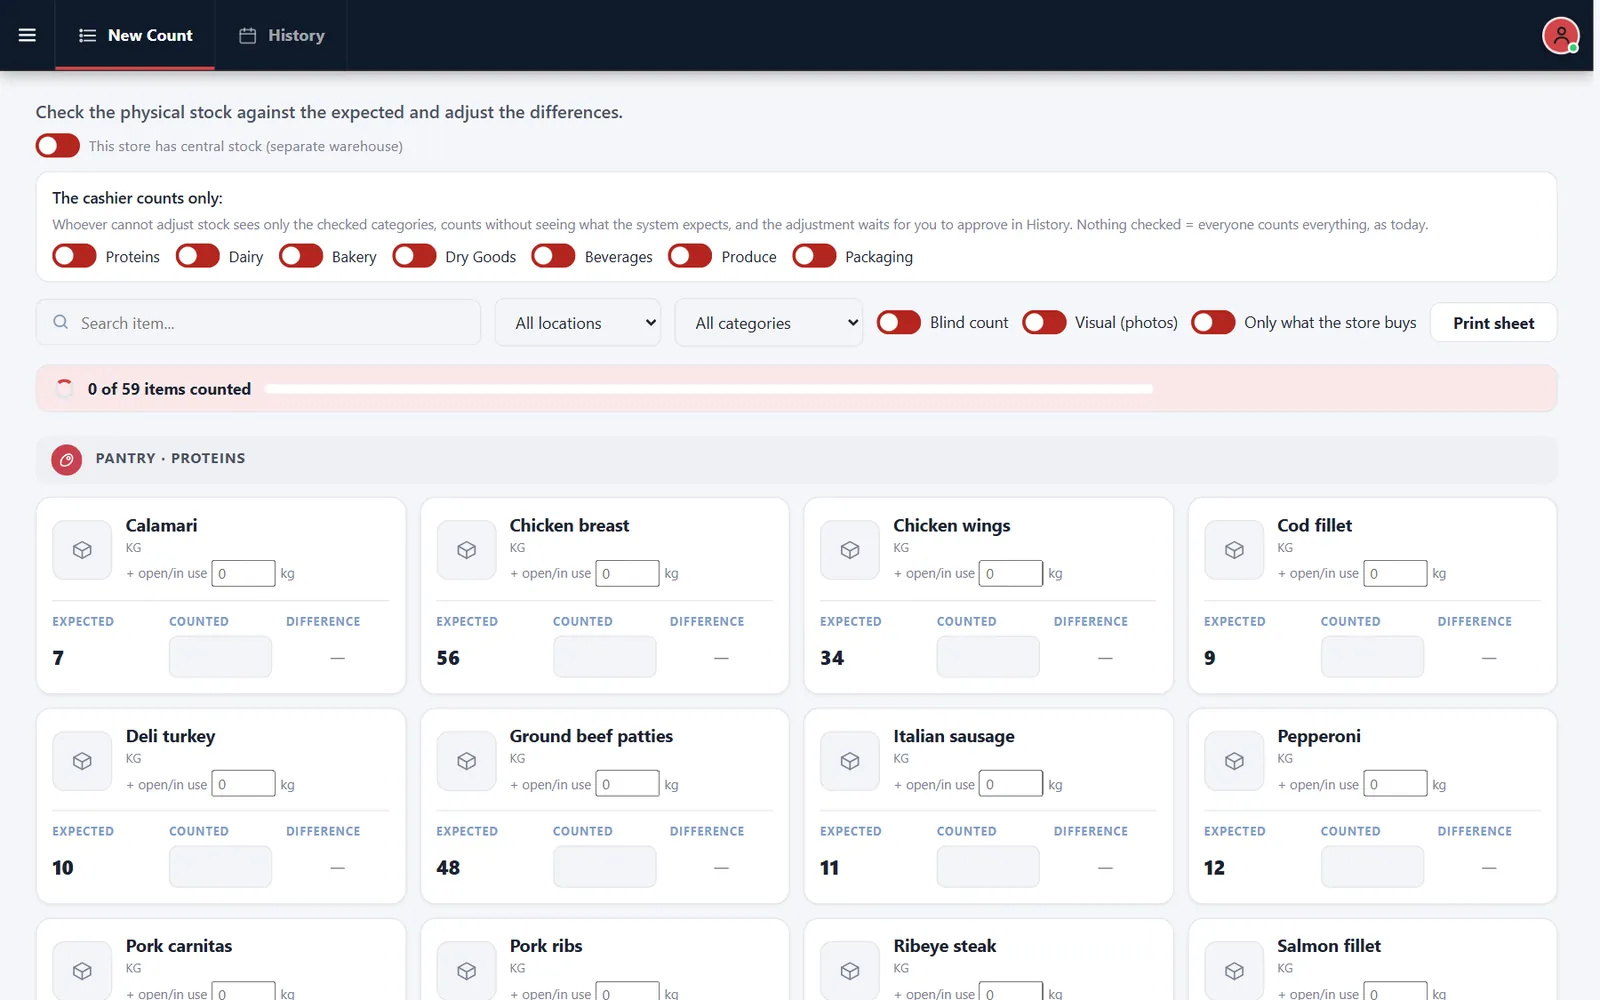
For a more controlled counting process, CounterChef supports counting by location and category, blind counts that hide the expected quantity, and reviewing differences before adjusting.
The goal is to make every inventory adjustment traceable to a reason.
Establish a weekly inventory routine your team can maintain
You do not necessarily need to count every product every day.
Set a schedule based on the importance of the product, purchasing frequency, and how quickly it moves.
For example, you might count frequently used spirits weekly and review slower-moving specialty products on a less frequent schedule. These are operational choices, not universal rules; the right frequency varies by concept and inventory volume.
Keep the schedule consistent.
Assign clear responsibility for counting, reviewing, and approving adjustments. Make sure the person responsible understands the difference between inventory quantity, actual usage, theoretical usage, and variance.
Review the results with your bar manager regularly.
Focus on questions such as:
- Which products have repeated unexplained differences?
- Are the same discrepancies appearing in the same locations?
- Have purchase costs changed?
- Are recipes being followed consistently?
- Are transfers and waste being documented?
- Is the inventory count taking too long because storage is poorly organized?
Use the answers to improve the operation.
A well-organized storage room, consistent bottle placement, clear recipes, and documented transfers can make inventory more accurate without adding unnecessary administrative work.
Frequently asked questions
How often should a restaurant do bar inventory?
Many independent restaurants choose weekly inventory counts because they provide a regular view of purchasing and product usage. However, the appropriate frequency varies by concept, sales volume, product value, and management needs. High-value or fast-moving spirits may deserve more frequent attention.
What is the difference between bar inventory and bar usage?
Bar inventory measures how much product the restaurant has on hand at a specific time. Bar usage measures how much product was consumed during a defined period. Beginning inventory, purchases, transfers, and ending inventory are used to calculate actual usage.
What does negative bar inventory variance mean?
Negative variance means theoretical usage is higher than actual usage. In other words, sales and standard recipes suggest that more product should have been consumed than your inventory records show. Possible causes include inaccurate counts, missing purchases, incorrect sales records, or recipe specifications that do not reflect actual preparation.
How can a restaurant reduce bar inventory variance?
Start by standardizing pour sizes, training employees to estimate partial bottles consistently, recording transfers and waste, checking sales entries, and investigating discrepancies before adjusting inventory. Regularly comparing actual usage with theoretical usage helps identify recurring problems and gives managers a clearer basis for operational decisions.
Related feature: Inventory counts.