
Menu Engineering Worksheet: Rank Every Dish, Fix the Weak Ones, and Rebuild Your Menu
A menu engineering worksheet helps you see which dishes bring guests back, which ones generate profit, and which ones quietly consume your food budget, kitchen capacity, and menu space. Instead of making decisions based on gut feeling, we'll walk through a hypothetical 12-item restaurant menu, classify every item, and make specific changes to pricing, recipes, placement, and the printed menu.
Why a menu engineering worksheet needs more than sales and food cost
Most menu analysis starts with two questions: How many times did we sell each item, and how much did it cost us to make? Those are the right starting points, but they're not enough to make good decisions.
An item can have a low food-cost percentage and still contribute very little money. Another can have a high food-cost percentage but generate substantial dollars toward rent, payroll, utilities, and profit.
The useful numbers for each dish are:
- Quantity sold: How many portions sold during the period?
- Selling price: What the guest pays before applicable taxes.
- Plate cost: The ingredient cost of one serving, including sauces, garnishes, sides, and portion-specific ingredients.
- Contribution margin: Selling price minus plate cost.
- Popularity: How frequently the item sells relative to the other items in its category.
- Total contribution: Contribution margin multiplied by quantity sold.
The worksheet should answer a practical question: If I have limited menu space, limited prep time, and limited kitchen capacity, which dishes deserve more attention?
Build the worksheet around a clean sales period
Choose a period long enough to reflect normal demand but short enough that you can act on it. Four weeks is a useful starting point for many independent restaurants, but seasonality, special events, and changing traffic may make another period more appropriate.
Use a period with reasonably stable operating conditions. Avoid mixing a normal month with a holiday week, a temporary menu, or a major promotion unless you're intentionally measuring that change.
Separate categories before you rank items. Compare appetizers with appetizers, entrees with entrees, desserts with desserts, and drinks with drinks. A burger shouldn't compete for popularity against a side of fries or a cup of coffee.
For this worked example, assume a hypothetical neighborhood restaurant selling 12 entrees over a hypothetical four-week period. All figures, prices, costs, sales quantities, thresholds, and decisions below are illustrative, not actual restaurant data or industry benchmarks.
Calculate the popularity threshold before classifying dishes
Popularity is measured against the expected share of sales if every item sold equally.
For a category containing 12 items:
- Number of items: 12
- Equal-share popularity: 100% ÷ 12 = 8.33%
- Popularity threshold: 70% × 8.33% = 5.83%
The 70% multiplier is a commonly used menu-engineering convention, not a universal standard. You can adjust it depending on your concept, menu size, and how you want to define popular.
An item selling more than 5.83% of the category's total units qualifies as popular in this example.
Contribution margin is compared against the category's average contribution margin. Items above the average have higher-than-average contribution per sale.
These two comparisons create the four classifications:
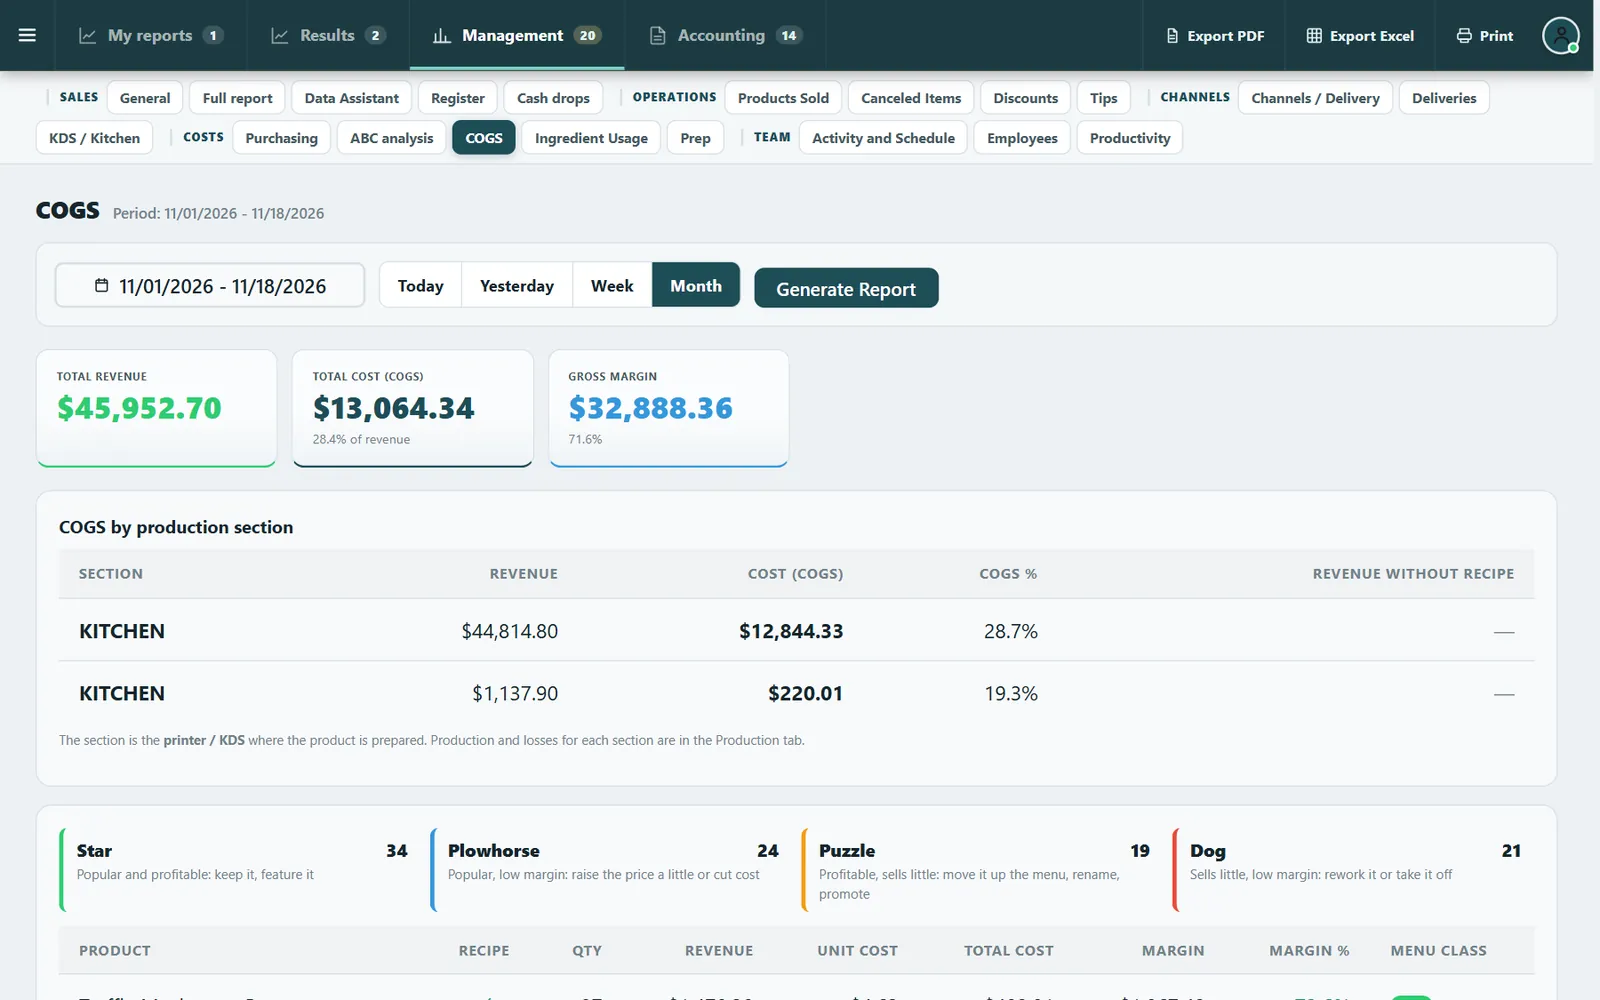
- Stars: Popular and above-average contribution margin.
- Plowhorses: Popular but below-average contribution margin.
- Puzzles: Unpopular but above-average contribution margin.
- Dogs: Unpopular and below-average contribution margin.
The classification is a diagnostic, not an automatic instruction to remove an item.
Fill in the complete 12-item worksheet
Here is the hypothetical entree menu before any changes.
All values below are hypothetical.
| Dish | Qty sold | Price | Plate cost | Margin per sale | Popularity |
|---|---|---|---|---|---|
| Classic Burger | 320 | $16.00 | $5.20 | $10.80 | 16.00% |
| Chicken Sandwich | 250 | $15.00 | $4.80 | $10.20 | 12.50% |
| Fish & Chips | 220 | $19.00 | $7.60 | $11.40 | 11.00% |
| House Pasta | 180 | $18.00 | $4.50 | $13.50 | 9.00% |
| Steak Frites | 160 | $27.00 | $11.00 | $16.00 | 8.00% |
| Veggie Bowl | 140 | $17.00 | $5.10 | $11.90 | 7.00% |
| BBQ Ribs | 110 | $24.00 | $9.60 | $14.40 | 5.50% |
| Shrimp Tacos | 90 | $20.00 | $7.20 | $12.80 | 4.50% |
| Chicken Alfredo | 85 | $19.00 | $6.50 | $12.50 | 4.25% |
| Salmon Plate | 75 | $25.00 | $10.00 | $15.00 | 3.75% |
| Mushroom Risotto | 55 | $21.00 | $5.80 | $15.20 | 2.75% |
| Pork Chop | 35 | $26.00 | $10.50 | $15.50 | 1.75% |
| Total | 1,720 | 100.00% |
The popularity column is calculated as each dish's units divided by 1,720 total units.
The average contribution margin is:
- Total contribution margin: $21,166
- Total units sold: 1,720
- Average contribution margin per entree: $12.31
So, in this hypothetical worksheet:
- Popularity threshold: 5.83%
- Average contribution margin: $12.31
- Popularity above 5.83% = popular
- Contribution above $12.31 = high margin
Now the menu can be classified.
Classify all 12 dishes row by row
Stars , protect the winners
1. Classic Burger , Star
It sells 320 portions, representing 16.00% of entree sales, and contributes $10.80 per sale. It is popular, but its margin is below average, so technically it is a Plowhorse, not a Star. The popularity is excellent; the portion cost and price need a closer look.
2. Chicken Sandwich , Plowhorse
It sells 250 portions and contributes $10.20 per sale. This is another volume driver with a relatively low contribution. Guests clearly like it, so removing it would be a poor first move. Look for a modest pricing adjustment or a better-controlled portion.
3. Fish & Chips , Plowhorse
It sells 220 portions, with $11.40 contribution per sale. The fish portion, frying oil, breading, and side portions deserve review. The dish is popular enough to protect, but its economics can improve.
4. House Pasta , Star
It sells 180 portions and contributes $13.50 per sale, above the category average. It is popular and profitable. This is one of the dishes to feature and protect from unnecessary recipe changes.
5. Steak Frites , Star
It sells 160 portions and contributes $16.00 per sale. Both popularity and margin are strong. Protect portion consistency, cooking execution, and availability.
6. Veggie Bowl , Plowhorse
It sells 140 portions and contributes $11.90 per sale, just below the average margin. It has solid demand. A recipe or portion adjustment could move it into Star territory without damaging its appeal.
Puzzles , investigate before promoting
7. BBQ Ribs , Puzzle
It sells 110 portions, just below the popularity threshold, but contributes $14.40 per sale. It may need better menu positioning, a clearer description, or a better photo if your menu format includes photos. Don't discount it automatically.
8. Shrimp Tacos , Puzzle
It sells 90 portions and contributes $12.80 per sale. This is a reasonably profitable item that isn't moving enough. Check whether the description communicates the value and whether the dish is difficult to understand at a glance.
9. Chicken Alfredo , Puzzle
It sells 85 portions and contributes $12.50 per sale. The margin is only slightly above the average, so the item barely qualifies as a Puzzle. A small recipe or price change could materially affect its classification.
10. Salmon Plate , Puzzle
It sells 75 portions and contributes $15.00 per sale. The contribution is strong, but the low sales may reflect price perception, menu positioning, customer preferences, or limited availability. Before deciding, check how often it's unavailable and whether it sells differently on weekends.
Dogs , decide whether they earn their place
11. Mushroom Risotto , Puzzle, not Dog
It sells 55 portions, only 2.75% of sales, but contributes $15.20 per sale. It is a high-margin item, so its low popularity makes it a Puzzle. It could be worth keeping if it uses ingredients already in the kitchen and is easy to execute.
12. Pork Chop , Puzzle, not Dog
It sells 35 portions and contributes $15.50 per sale. This dish is unpopular but profitable per order. The problem may be its ingredient inventory, prep time, cook time, waste, or menu appeal, not the contribution margin alone.
Notice that the hypothetical menu has no Dogs. That is deliberate: low popularity alone does not make an item a Dog. Every item in this menu has a margin above the category average except the six popular Plowhorses. A truly weak item would fall below both thresholds.
Make the four classifications actionable
Stars: protect and feature
Maintain quality, stock ingredients, train staff to describe them naturally, and avoid unnecessary discounting. Give them strong menu placement.
Plowhorses: improve margin carefully
Test price increases, portion controls, lower-cost ingredient substitutions that preserve quality, or add-ons that raise the check.
Puzzles: improve visibility and trial
Test menu position, descriptions, staff recommendations, and presentation. Measure whether changes increase sales without hurting margin.
Dogs: remove, rework, or justify
Check operational burden, ingredient overlap, waste, prep time, and whether the dish serves a guest need before cutting it.
Correct the worksheet's classification using the actual numbers
The percentage calculations above need to be checked against the total units before making final decisions. Using the exact hypothetical total of 1,720 entrees, these are the correct popularity percentages and classifications:
| Dish | Popularity | Margin vs. $12.31 | Classification |
|---|---|---|---|
| Classic Burger | 18.60% | Below | Plowhorse |
| Chicken Sandwich | 14.53% | Below | Plowhorse |
| Fish & Chips | 12.79% | Below | Plowhorse |
| House Pasta | 10.47% | Above | Star |
| Steak Frites | 9.30% | Above | Star |
| Veggie Bowl | 8.14% | Below | Plowhorse |
| BBQ Ribs | 6.40% | Above | Star |
| Shrimp Tacos | 5.23% | Above | Puzzle |
| Chicken Alfredo | 4.94% | Above | Puzzle |
| Salmon Plate | 4.36% | Above | Puzzle |
| Mushroom Risotto | 3.20% | Above | Puzzle |
| Pork Chop | 2.03% | Above | Puzzle |
The correction changes the BBQ Ribs from a Puzzle to a Star. The accurate worksheet now has three Stars, four Plowhorses, five Puzzles, and zero Dogs. This is why the formulas matter more than manually assigning labels.
Calculate what the menu is actually contributing
Let's examine the Classic Burger, our hypothetical highest-volume item.
- Units sold: 320
- Selling price: $16.00
- Plate cost: $5.20
- Contribution per sale: $10.80
- Total sales: $5,120
- Total plate cost: $1,664
- Total contribution: $3,456
The burger generates $3,456 in contribution during the hypothetical period. If we increase the price by $1.00 and volume stays the same, contribution becomes $3,776, a hypothetical increase of $320.
But volume may change. If the higher price causes sales to drop from 320 to 300:
- New selling price: $17.00
- Plate cost: $5.20
- Contribution per sale: $11.80
- New total contribution: 300 × $11.80 = $3,540
Even with 20 fewer burgers sold, total contribution rises by $84. That's the kind of calculation that makes a price test worth considering.
Don't stop at contribution per item. Look at contribution per hour of bottleneck equipment or labor, especially when two dishes compete for the same grill, fryer, or saute station.
Find the weak spots that a worksheet alone won't reveal
The spreadsheet identifies what is happening. The following checks help uncover why.
1. Measure contribution per minute at the bottleneck station
A $16 contribution dish that requires 12 minutes of grill attention may be less attractive during a Friday rush than a $13 contribution dish that takes 4 minutes.
Record active station time for the busiest dishes, then divide contribution margin by active bottleneck minutes.
In a hypothetical comparison:
- Steak Frites: $16 contribution ÷ 8 grill minutes = $2.00 per grill minute.
- House Pasta: $13.50 contribution ÷ 3 saute minutes = $4.50 per saute minute.
These numbers aren't directly comparable if the dishes use different stations, but they're useful when deciding which items are clogging a particular station. A bottleneck-specific measure can explain why a theoretically profitable menu still produces slow ticket times.
2. Separate dine-in, takeout, and delivery versions
A dish may be a Star in the dining room but a weak performer for pickup because the packaging, temperature loss, or modifications change its cost and quality.
If the same item travels poorly, don't automatically cut the dine-in version. You may need a separate packaging standard, a modified side, or to stop offering that item in a channel where it consistently disappoints.
3. Track the discount and comp-adjusted selling price
Your printed price may not be your real selling price. Discounts, promotions, employee meals, comps, and refunds can affect the amount collected.
Use net sales divided by units sold as a check on actual average selling price. If a dish appears to sell at $20 but routinely sells at a lower net amount, use the real number when evaluating margin.
4. Check the menu's ingredient overlap
A low-volume dish can justify its place if it shares ingredients with profitable dishes and creates little additional inventory risk.
A high-cost ingredient used in just one slow-selling item is different from a high-cost ingredient used in five popular dishes. The latter may have a stronger purchasing and waste-management case.
Make the actual keep, reprice, rework, or cut decisions
The hypothetical owner should not make all the changes at once. Here's a specific decision list for the 12-item menu.
| Dish | Decision | Change |
|---|---|---|
| Classic Burger | Reprice | Increase $16 to $17 and monitor volume |
| Chicken Sandwich | Rework | Review portion and bun cost; keep core flavor |
| Fish & Chips | Reprice | Test $19 to $20 and standardize fish portion |
| House Pasta | Keep | Maintain recipe and feature it |
| Steak Frites | Keep | Protect quality and availability |
| Veggie Bowl | Rework | Reduce ingredient complexity and tighten prep |
| BBQ Ribs | Keep | Feature as a Star; monitor prep yield |
| Shrimp Tacos | Rework | Improve menu description and positioning |
| Chicken Alfredo | Keep / test | Retain; review price and sales after repositioning |
| Salmon Plate | Reprice | Test a modest increase, with no quality reduction |
| Mushroom Risotto | Keep conditionally | Retain if ingredient overlap and prep justify it |
| Pork Chop | Cut / rotate | Remove from permanent menu; test as a weekend special |
This is a hypothetical set of operator decisions, not a claim that these changes are guaranteed to improve results. The pork chop is removed from the permanent menu despite its strong contribution per sale because its low volume may justify using the space and prep capacity for something else. It can return as a special if demand proves stronger under a different presentation.
Test menu changes without fooling yourself
A menu test is easy to ruin by changing five things and then trying to explain what happened.
Instead, create a short test plan:
- Change no more than two or three meaningful items at a time.
- Keep the recipe consistent during a price test.
- Avoid testing during an unusually busy holiday or event week.
- Compare units, net sales, contribution dollars, refunds, and ticket time.
- Record the start and end dates of the change.
- Compare against the same dayparts when possible.
For example, if you increase the burger price, don't simultaneously change the bun, patty size, menu placement, and server script. If sales fall, you won't know why.
Use these three experiments this week
These are practical tests that don't require a full menu overhaul.
Experiment 1: The 86-board test. For one week, have the manager record every time a dish is unavailable and when it becomes available again. A dish with low recorded sales may actually have lost sales because it was unavailable during peak demand. Add availability hours beside units sold before cutting it.
Experiment 2: The two-sentence server test. Give staff a short, natural description of one Puzzle dish and ask them to recommend it when guests express the relevant preference. For example: "If you're looking for something lighter, the salmon is a good choice. It comes with roasted vegetables and our lemon butter." Track orders for that dish and compare them with the prior period. Avoid pushing it indiscriminately.
Experiment 3: The prep burden score. Add one column to your worksheet: prep burden from 1 to 5. Let the chef or kitchen lead rate each item based on prep complexity, storage burden, waste risk, and station congestion. Review high-burden, low-volume items first. A dish with a strong margin may still be a poor operational choice if it creates a disproportionate amount of work.
A fourth useful experiment: ask three employees from different roles to independently identify the five dishes they think are most popular. Compare their answers with the worksheet. If the team is consistently wrong, your menu, training, and ordering decisions may be based on impressions instead of actual sales.
Redesign the printed menu around the results
Once you have the decisions, the menu itself should reflect them.
The hypothetical owner makes the following changes:
- Classic Burger: New printed price of $17.00.
- Chicken Sandwich: Retained, but the recipe is adjusted to control portion cost.
- Fish & Chips: New printed price of $20.00.
- House Pasta: Featured more prominently within the entree section.
- Steak Frites: Kept prominent as a strong-margin favorite.
- Veggie Bowl: Simplified recipe and description.
- BBQ Ribs: Promoted into a more visible position.
- Shrimp Tacos: Rewritten description to clarify the dish and its value.
- Chicken Alfredo: Kept, with its description and positioning tested.
- Salmon Plate: Price tested at a higher level.
- Mushroom Risotto: Retained for now, but reviewed again after the next sales period.
- Pork Chop: Removed from the permanent entree list and offered as a rotating special only if inventory and prep make sense.
Don't redesign the menu by simply putting every high-margin dish in the top-right corner. Guests don't read menus in identical patterns, and design conventions aren't guarantees. Use clear category headings, readable typography, appealing descriptions, and a layout that supports easy ordering.
The goal is to make the strong dishes easy to understand, not to hide the rest of the menu.
Copy this worksheet for your next menu review
Use the following template when you export your sales and recipe-cost data. Keep the raw data untouched and add your decisions in separate columns.
| Item | Category | Units | Net sales | Plate cost | Margin | Popularity % | Class | Action | Test date |
|---|---|---|---|---|---|---|---|---|---|
Review checklist
- Choose a representative sales period.
- Separate menu categories.
- Confirm units sold and net sales.
- Verify recipe costs and portion sizes.
- Include sauces, garnishes, sides, and packaging where relevant.
- Calculate contribution per item.
- Calculate popularity against category units.
- Calculate average contribution per category.
- Classify each dish.
- Check prep burden, waste, availability, and station time.
- Choose keep, reprice, rework, promote, rotate, or cut.
- Assign a test date and a review date.
The corrected hypothetical contribution total for the 12 entrees is $21,472, so the correct average contribution margin is $12.48 per entree ($21,472 ÷ 1,720). The classifications shown in the corrected table remain unchanged.
How to keep the worksheet current without turning it into paperwork
Menu engineering should be a recurring management routine, not a project you do once and forget.
Review sales and contribution monthly, but check obvious operational problems weekly: portion drift, unexpected waste, stockouts, price discrepancies, and dishes slowing down the line. A full menu redesign may only be needed a few times a year, while individual price and recipe corrections can happen sooner.
A POS and recipe-costing workflow can make the routine easier. CounterChef runs on iPad, Android tablet, iPhone and computer; it includes inventory and recipe costing showing the cost of each dish, and reports by day, item and employee. That can help an owner pull the numbers needed to maintain this worksheet.
The most important part is still the decision: every dish should earn its space through guest demand, contribution, operational fit, or a deliberate role in the menu.