
Restaurant Break-Even Point: Turn Your Monthly Number Into a Daily Sales Target
A restaurant can be busy every night and still lose money because sales have to cover a specific combination of fixed expenses, variable costs, and labor before the owner earns a profit. Calculating your restaurant break-even point is useful, but the real value comes from translating it into a number your manager can use before opening, your servers can understand during a shift, and you can adjust when rent, menu prices, or staffing changes.

Break-even sales tell you when the restaurant stops losing money
Break-even is the point where total revenue equals total expenses. At that point, the restaurant has covered its operating costs, but it has not generated a profit.
The basic calculation is:
Break-even sales = Fixed costs ÷ Contribution margin ratio
The contribution margin ratio is the percentage of sales left after variable costs are paid.
If you sell $100 worth of food and beverages, but $30 goes toward ingredients, packaging, payment processing, and other costs that rise with sales, you have $70 left to help cover fixed costs and eventually produce profit.
That $70 is your contribution margin.
Break-even is not the same as a sales goal. It is the floor your operation must reach under a particular cost structure. Your actual sales target should be higher to provide a cushion for slow days, repairs, unexpected expenses, owner compensation, debt payments, and reinvestment.
The number also changes. A break-even calculation from January may not be valid in June if rent changes, insurance renews, wages rise, your menu prices move, or your business mix shifts toward catering and takeout.
Separate fixed costs from variable costs before calculating anything
A common mistake is putting every expense into one monthly total and dividing by sales. That tells you what happened, but it doesn't give you a reliable break-even model.
You need to understand how each cost behaves as sales change.
Fixed costs stay relatively stable as sales fluctuate
Fixed costs generally don't change simply because you served 20 more guests tonight. They are commitments you must cover even during a slow week.
Examples include:
- Base rent and common-area charges
- Insurance premiums
- Equipment leases
- Certain software or service subscriptions
- Property taxes, if applicable to your business
- Loan payments, when building a cash-flow break-even model
- Salaried management, where compensation is fixed
- Base utilities or contracted services that do not change materially with volume
Some fixed expenses are only fixed for a period. Rent may increase at renewal. Insurance may change annually. A lease payment can be stable for the month but not for the year.
For practical planning, use the amount you expect to pay during the period you're forecasting, not last year's amount.
Variable costs rise as sales or activity increase
Variable costs generally move with revenue, orders, covers, or production.
Examples include:
- Food ingredients
- Beverage ingredients
- Packaging
- Disposable paper goods
- Per-order delivery supplies
- Credit-card processing fees
- Sales-based commissions
- Hourly labor that you add to meet demand
- Some cleaning, linen, and utility consumption
Labor deserves special attention. It is not entirely fixed or entirely variable in most restaurants.
Your opening manager, scheduled prep cook, and minimum line coverage may be unavoidable for a particular shift. Additional dishwashing hours, an extra server, or a second prep shift may be triggered by volume.
For break-even planning, decide which labor is part of your base operating commitment and which labor you expect to rise with sales. Don't put the same labor dollars in both categories.
Build a useful cost classification instead of arguing over labels
Use the classification that helps you make decisions. For a monthly forecast, you might treat your minimum scheduled staffing as fixed for that month, while additional labor above that minimum is variable.
For a weekly forecast, the same labor may be semi-variable because staffing changes with reservations, events, and sales forecasts.
Your model doesn't need accounting perfection to be useful, but it does need consistency. If you change your classifications every time you calculate the ratio, comparisons become meaningless.
Calculate the contribution margin ratio from real sales and costs
Once you have separated variable costs, calculate their share of sales.
Contribution margin ratio = (Sales − Variable costs) ÷ Sales
You can also calculate it as:
Contribution margin ratio = 1 − Variable cost percentage
For example, if variable costs equal 35% of sales, the contribution margin ratio is 65%. Every additional dollar of sales contributes approximately 65 cents toward fixed costs and profit, assuming the cost structure stays consistent.
Use net sales for the model, excluding sales tax collected on behalf of the government and adjusting for discounts, refunds, and comps appropriately.
If you operate multiple revenue streams, consider calculating separate contribution margins for dine-in, takeout, catering, alcohol, and other meaningful categories. A $100 catering order may not contribute the same amount as $100 of dine-in sales once packaging, labor, commissions, and food costs are considered.
Work through a hypothetical restaurant break-even calculation
Let's build a practical example for an independent neighborhood restaurant. Every figure below is hypothetical and intended to demonstrate the calculation, not represent an industry benchmark.
Assume the restaurant has the following monthly operating costs:
| Monthly fixed cost | Hypothetical amount |
|---|---|
| Rent and occupancy charges | $6,000 |
| Insurance | $800 |
| Equipment leases | $700 |
| Manager salaries | $5,500 |
| Base staffing commitment | $4,000 |
| Utilities base estimate | $900 |
| Other fixed operating expenses | $1,100 |
| Total fixed costs | $19,000 |
Now assume variable costs as a percentage of net sales:
| Variable cost | Hypothetical percentage |
|---|---|
| Food and beverage cost | 30% |
| Hourly labor above base coverage | 12% |
| Card processing | 3% |
| Packaging and other variable supplies | 2% |
| Total variable costs | 47% |
The contribution margin ratio is therefore:
100% − 47% = 53%
For every dollar of net sales, this restaurant retains approximately $0.53 to cover fixed costs and profit.
Monthly break-even sales:
$19,000 ÷ 0.53 = $35,849.06
The restaurant must generate approximately $35,849 in net sales per month to cover these modeled costs.
Hypothetical break-even summary
$35,849
53%
$19,000
47%
If the restaurant is open 30 days in this hypothetical month:
$35,849.06 ÷ 30 = $1,194.97 per day
That is an average daily break-even of about $1,195.
But don't automatically set every day to $1,195. If Tuesday normally does half the sales of Saturday, equal daily targets are disconnected from reality. Allocate the monthly target based on the restaurant's actual trading pattern.
Turn the monthly break-even into a daily target the team can see
This is where the calculation becomes operational.
A monthly break-even number belongs in the owner's financial review. A daily target belongs on the shift plan.
Start with the month's required sales, then distribute them across operating days using the expected share of revenue for each day. You can use last year's comparable weeks, recent sales patterns, reservation counts, events, seasonality, or a forecast built from your own records.
In the hypothetical restaurant, assume the monthly break-even is $35,849.06.
Instead of splitting it equally, use this hypothetical distribution:
| Day | Share of monthly sales | Break-even sales target |
|---|---|---|
| Monday | 8% | $2,867.92 |
| Tuesday | 9% | $3,226.42 |
| Wednesday | 10% | $3,584.91 |
| Thursday | 12% | $4,301.89 |
| Friday | 17% | $6,094.34 |
| Saturday | 22% | $7,886.79 |
| Sunday | 22% | $7,886.79 |
| Total | 100% | $35,849.06 |
These percentages are hypothetical. A restaurant that closes on Sundays, operates lunch only, or has a strong brunch trade should build a different distribution.
The target should be visible before the shift starts. The manager can discuss it during pre-shift without turning the meeting into a finance lecture.
For example:
- Tonight's net sales target: $6,094.
- Expected covers: 145.
- Target average check: $42.03.
- At the halfway point, check whether actual sales and covers are tracking.
- If the room is slower than forecast, review reservations, walk-in patterns, staffing, and available promotions.
The target is a planning tool, not a reason to pressure staff into inappropriate upselling or rush guests.
Calculate the break-even number of covers
Sales dollars are helpful, but covers make the target more tangible.
A cover is one guest served. To calculate the number of covers required to break even:
Break-even covers = Break-even sales ÷ Average net sales per cover
Suppose the hypothetical restaurant averages $38 in net sales per cover.
Monthly covers required:
$35,849.06 ÷ $38 = 943.40 covers
The restaurant needs approximately 944 covers in that hypothetical month to reach break-even.
Daily covers using the average daily break-even:
$1,194.97 ÷ $38 = 31.45 covers
That is about 32 covers per day on average.
But again, the average isn't a schedule. A Saturday with a $7,886.79 target at a $38 average check requires roughly 208 covers, while a Monday with a $2,867.92 target requires about 76 covers.
If your dining room seats 60 people, 208 covers may require multiple seatings, a strong takeout channel, a higher average check, or a different operating plan. Break-even analysis can expose a capacity problem that is easy to miss when everyone is simply hoping for a busy weekend.
Set targets based on the day, the capacity, and the check
A daily sales target can be translated into three controllable components:
Sales = Covers × Average check
For the hypothetical Saturday:
- Sales target: $7,886.79
- Planned covers: 208
- Required average check: $37.92
This is a much more useful conversation than telling the team to "sell more."
If the restaurant has only forecast 175 covers, then the required average check becomes $45.07. The owner can decide whether that is plausible based on the menu, guest behavior, and reservation mix.
If neither covers nor average check can reasonably reach the target, don't simply post a larger number. Revisit the forecast, staffing plan, cost structure, pricing, or the business model.
A break-even target should be challenging enough to create focus but grounded in what the operation can actually serve.
Use the contribution margin to test rent increases before signing
Rent is often treated as an unavoidable bill, but a new lease or renewal changes the sales requirement immediately.
In our hypothetical restaurant, fixed costs are $19,000 and the contribution margin is 53%. Monthly break-even is $35,849.06.
Now assume the landlord increases monthly occupancy costs by $750.
New fixed costs:
$19,000 + $750 = $19,750
New break-even:
$19,750 ÷ 0.53 = $37,264.15
The rent increase requires an additional $1,415.09 in monthly sales just to break even.
- Before rent increase: Monthly break-even sales $35 849
- After $750 increase: Monthly break-even sales $37 264
That is not an additional $750 in sales. Because some of that extra revenue is consumed by variable costs, you need substantially more sales to generate the $750 contribution required.
Before agreeing to higher occupancy costs, calculate the additional sales, covers, and peak-hour capacity required. Ask whether the location, menu, hours, or customer base can realistically support that increase.
Test a menu price increase against your current sales mix
A price increase can improve contribution margin, but the result depends on whether guests continue buying at the same rate and whether ingredient costs remain stable.
Suppose our hypothetical restaurant increases prices enough to improve its contribution margin ratio from 53% to 55%, with fixed costs unchanged at $19,000.
New break-even:
$19,000 ÷ 0.55 = $34,545.45
That's a reduction of approximately $1,303.61 in monthly break-even sales compared with the original model.
A modest improvement in contribution margin can reduce the amount of revenue required to cover overhead.
However, don't apply a blanket increase without checking the menu. If you increase the price of a popular low-margin dish, guests may switch to another dish. If the price increase changes the number of covers, your model needs to reflect that.
A practical approach is to identify five high-volume items, calculate their current ingredient cost and selling price, then test a proposed price change. Look at portion consistency, ingredient substitutions, waste, and whether the price still makes sense for the guest.
The goal is not to charge more indiscriminately. It's to improve the dollars contributed by the menu you actually sell.
Calculate what a new hire must contribute before adding the position
Hiring decisions are easier when you calculate the incremental sales required rather than asking whether the restaurant "feels busy."
Assume the hypothetical restaurant is considering an additional employee costing $3,200 per month, including the employer's expected payroll burden for planning purposes.
If the contribution margin ratio remains 53%, the additional sales required to cover the position are:
$3,200 ÷ 0.53 = $6,037.74 per month
If the restaurant operates 30 days, that is an average of $201.26 in additional daily sales.
At a hypothetical average check of $38, the additional sales requirement is approximately:
$6,037.74 ÷ $38 = 159 additional covers per month
Or about 5.3 additional covers per operating day, averaged across the month.
This is an incremental calculation, not a prediction that the hire will generate sales. The employee may improve service, reduce ticket times, prevent overtime, protect guest experience, or make existing sales possible. Those benefits need to be considered separately.
If the position is a prep cook, for example, the value may be the ability to open another station or reduce overtime. If it is a server, the value may be serving more guests without degrading service.
Confirm wage, overtime, payroll tax, and other employment requirements with the appropriate state or local authorities or a qualified payroll professional. Don't underestimate the fully loaded cost of a new position.
Create a sales target that accounts for slow days and uneven weeks
A restaurant rarely earns revenue evenly throughout the month. Weather, holidays, local events, school schedules, reservations, and seasonal patterns can move sales dramatically.
A useful owner practice is to divide the break-even target into three levels:
| Target level | Purpose |
|---|---|
| Break-even | Covers modeled operating expenses |
| Operating target | Covers expenses plus a planned cushion |
| Stretch target | A strong result that supports additional profit or reinvestment |
For example, using the hypothetical $35,849 monthly break-even:
- Break-even target: $35,849
- Operating target with a hypothetical 10% cushion: $39,434
- Stretch target with a hypothetical 20% cushion: $43,019
These cushion percentages are illustrative planning choices, not industry benchmarks.
If you consistently finish just above break-even, you may still be vulnerable to repairs, a slow week, unexpected food waste, or a payroll mistake. The cushion gives you breathing room.
Three operating experiments to try this week
Most break-even articles stop at the formula. The useful part is what you do with the number on the floor.
1. Run a "target versus forecast" pre-shift check
For every shift this week, write down:
- The break-even sales target for that day.
- The sales forecast based on reservations, recent patterns, and expected walk-ins.
- The number of covers you expect.
- The average check required to reach the target.
- The staffing plan.
If the forecast is below break-even, identify the gap before the shift begins. Can you reduce unnecessary prep? Adjust labor without compromising service? Promote a profitable special? Improve reservation pacing?
Don't wait until closing to discover the shortfall.
2. Create a "sales gap" board without blaming the team
Write the daily target and the current sales gap on a manager-only sheet or appropriate staff board.
Example:
| Shift checkpoint | Net sales | Gap to $4,000 target |
|---|---|---|
| Opening | $0 | $4,000 |
| Mid-shift | $1,450 | $2,550 |
| Dinner rush | $2,800 | $1,200 |
| Closing | $4,260 | +$260 |
The $4,000 target and figures are hypothetical.
This shows how the shift is progressing. It can also reveal that most of your sales arrive in a narrow window, helping you schedule breaks, prep, and coverage more intelligently.
Use the board to make decisions, not to shame people. Sales are affected by demand, weather, reservation volume, and many factors outside an employee's control.
3. Track the break-even cost of one empty seat-hour
An empty seat isn't automatically a lost sale. But when you have unused capacity during a period when you could have served guests, it is worth examining.
Take the daily target and divide it by the seating capacity and available seatings to estimate what the operation needs from its capacity.
For example, a hypothetical 40-seat dining room with two usable seatings has 80 potential seatings for guests in that service period. If the period's sales target is $3,200, the required sales per available seating position would be:
$3,200 ÷ 80 = $40
This is not the same as actual sales per occupied seat. It is a capacity planning figure.
Compare reservations, walk-ins, turn times, cancellations, and average check. If you repeatedly miss the target because the dining room is half empty, the issue may be demand generation or opening hours. If the room is full but the target is missed, average check, throughput, pricing, or menu mix may be the problem.
These are very different operational problems, and break-even analysis helps you tell them apart.
Use this worksheet to calculate and update break-even every month
Copy this template into your monthly review. Use actual figures from your books and adjust the model when you know about upcoming changes.
| Input | Your figure |
|---|---|
| Monthly fixed costs | $_____ |
| Food and beverage variable cost % | _____% |
| Variable labor % | _____% |
| Processing fees % | _____% |
| Packaging and supplies % | _____% |
| Other variable costs % | _____% |
| Total variable cost % | _____ % |
| Contribution margin % | _____ % |
| Monthly break-even sales | $_____ |
| Operating days this month | _____ |
| Average daily break-even | $_____ |
| Average net sales per cover | $_____ |
| Average daily break-even covers | _____ |
Use these formulas:
- Total variable cost percentage = all variable costs ÷ net sales.
- Contribution margin percentage = 100% − total variable cost percentage.
- Monthly break-even sales = fixed costs ÷ contribution margin percentage.
- Average daily break-even = monthly break-even ÷ operating days.
- Break-even covers = break-even sales ÷ average net sales per cover.
Monthly owner review checklist
- Confirm actual fixed expenses and any new commitments.
- Review food, beverage, labor, processing, and packaging costs.
- Check whether variable cost percentages changed.
- Recalculate contribution margin.
- Calculate monthly break-even.
- Distribute the target across days using your sales pattern.
- Check the target against covers, seating, and average check.
- Identify the three weakest shifts or dayparts.
- Assign one operating action to address each gap.
- Review actual sales against targets at the end of the week.
Keep the previous month's calculation. Comparing the two will tell you whether the business is getting easier or harder to operate at the same sales volume.
Use restaurant operating data to make the target actionable
Your break-even model is only as useful as the information feeding it. Sales reports tell you how much came in, but you also need a way to identify what was sold, when it was sold, and how costs are changing.
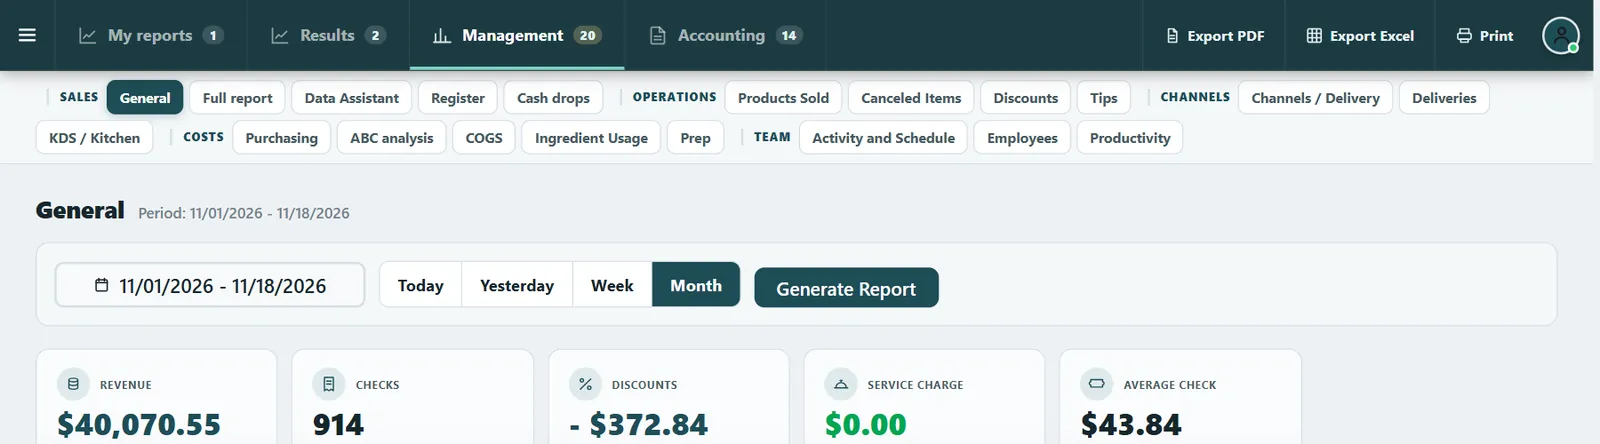
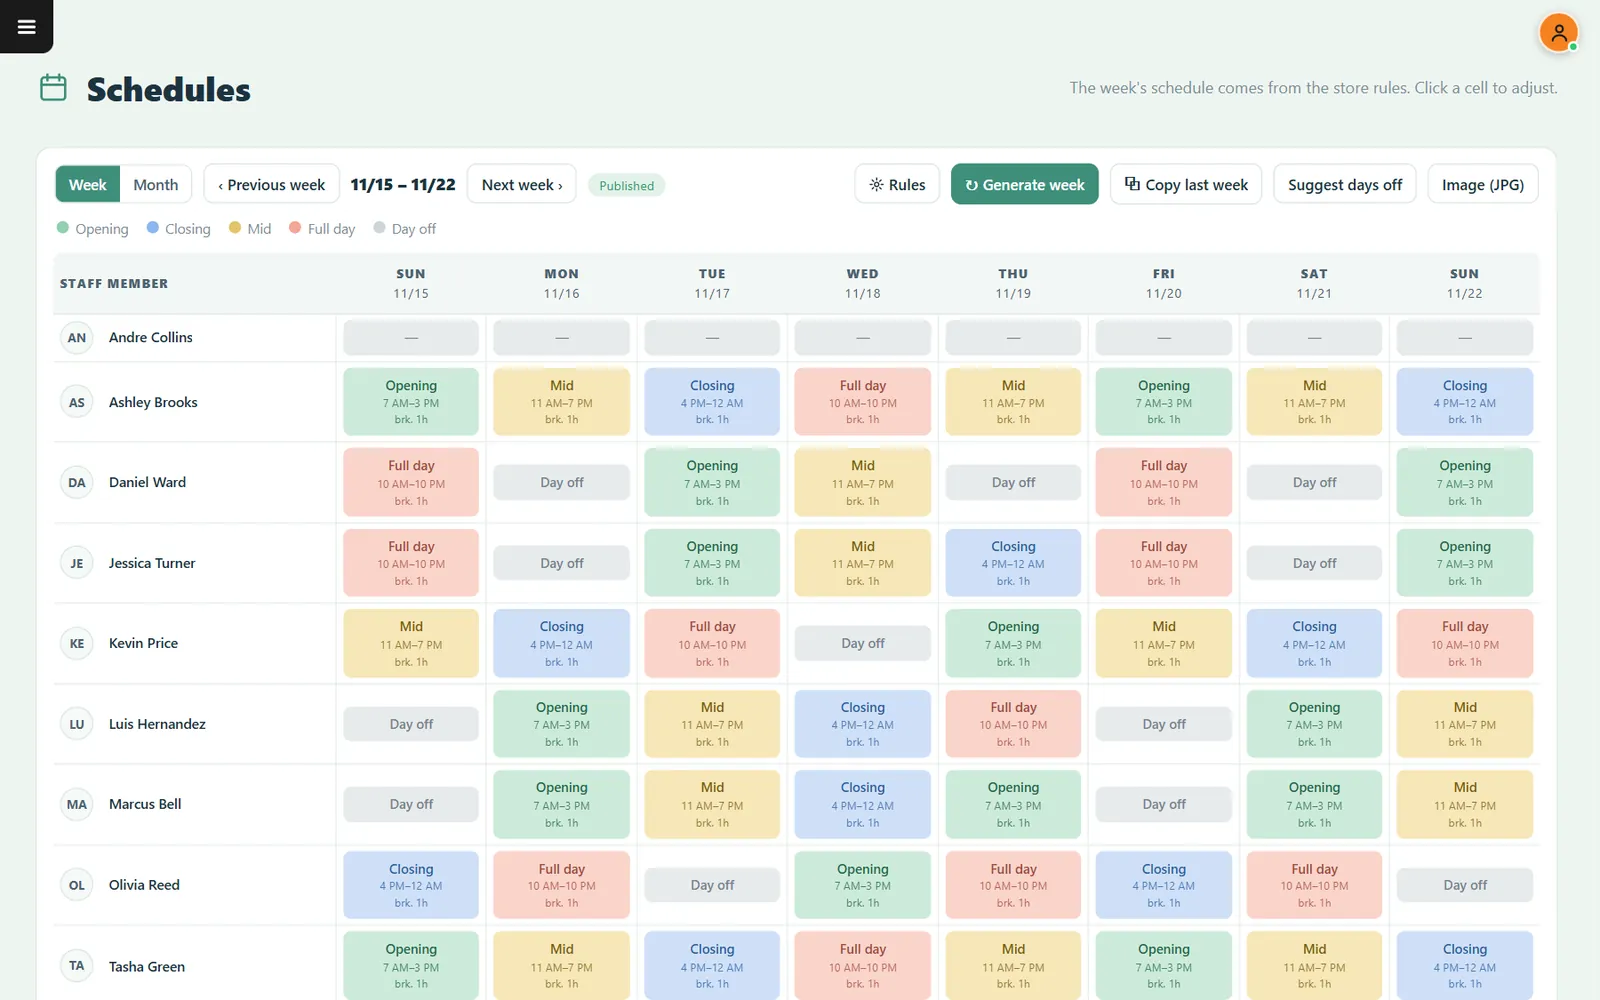
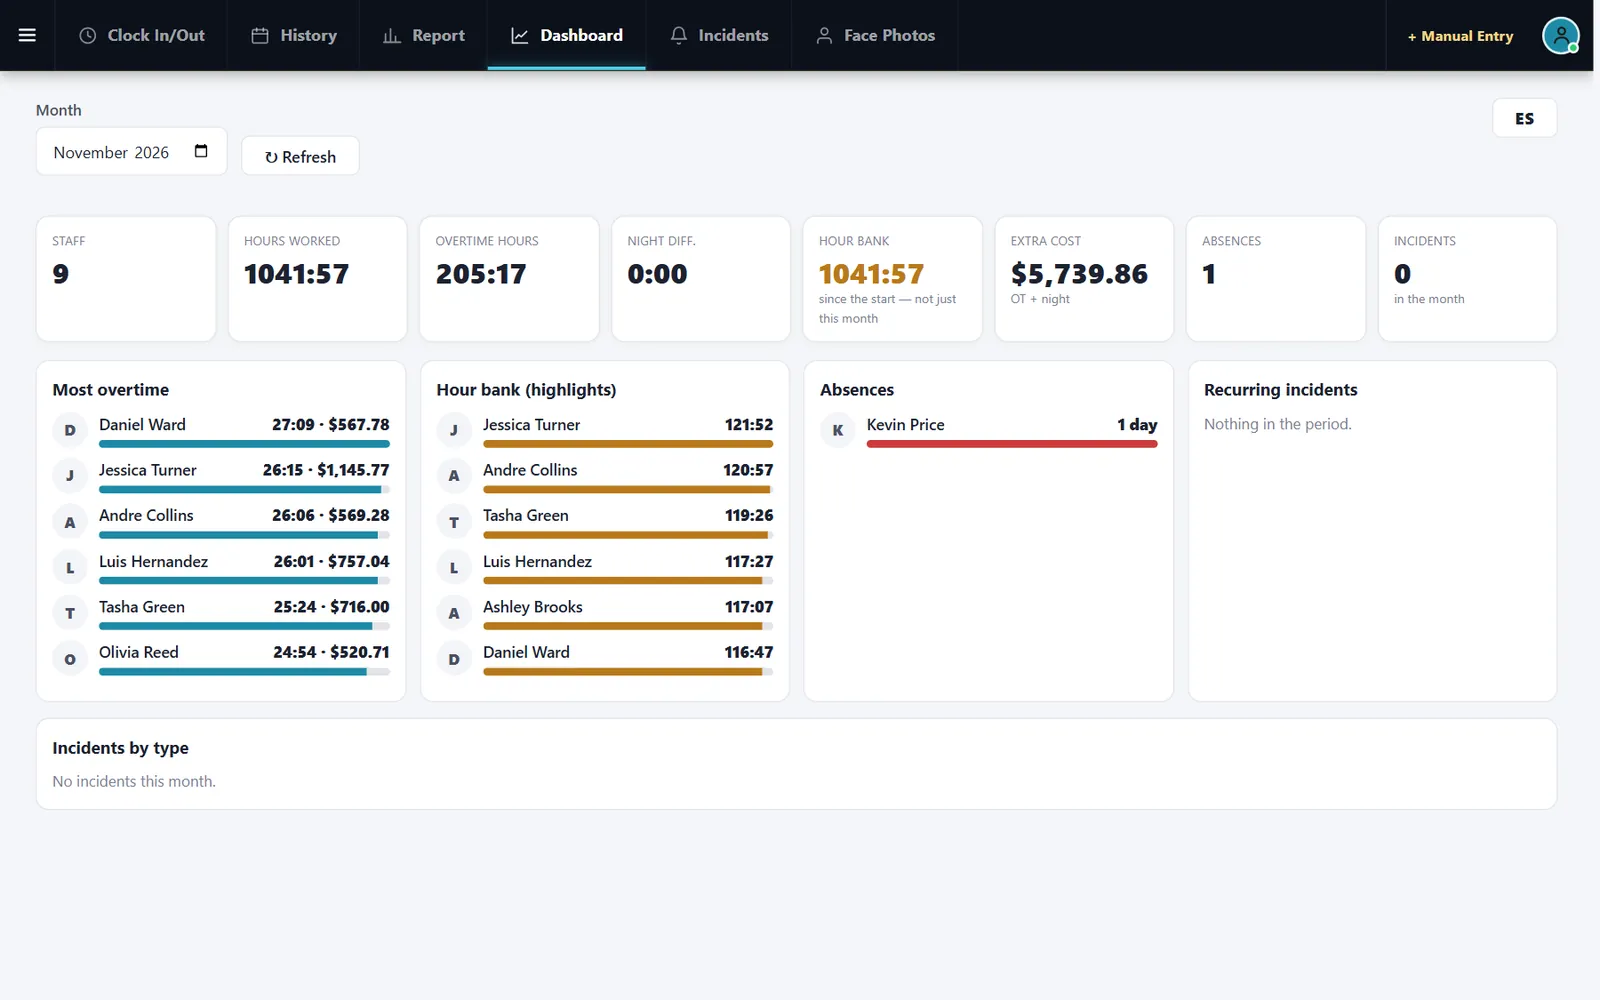
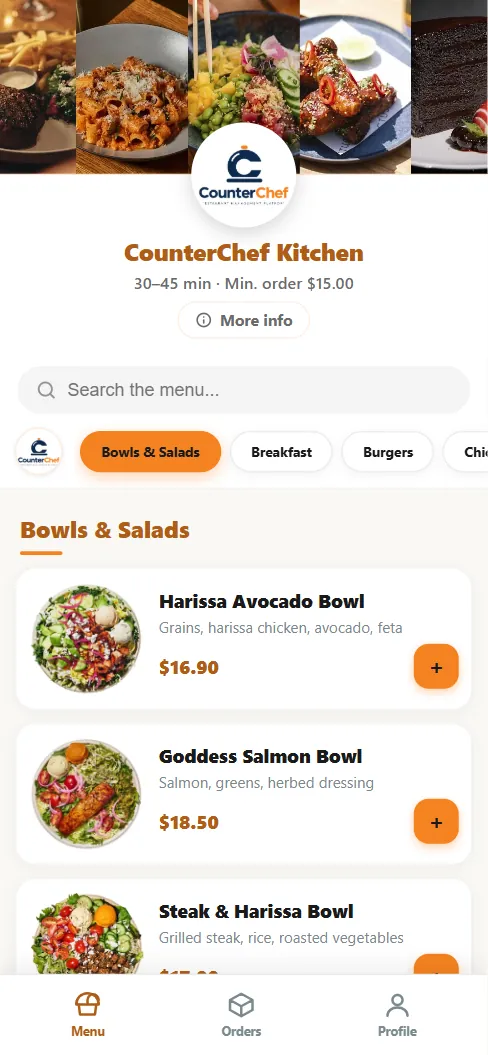
CounterChef runs on iPad, Android tablet, iPhone and computer. It includes an online menu for pickup and delivery with delivery areas by ZIP code, each with its own fee and estimated time; a kitchen display with ticket timers; a table map and server phones for dine-in; employee clock-ins on a tablet or computer and schedules built in the system; tip sharing by percentage or hours worked; inventory and recipe costing showing the cost of each dish; loyalty points and gift cards; sales tax rates with up to three decimals and by category; and reports by day, item and employee.
Use the information you collect to reconcile actual sales with the assumptions in your break-even model. The purpose is to make the target reflect the operation you are running today, not the restaurant you planned to run six months ago.