
Restaurant Financial Reports: What to Read Daily, Weekly, and Monthly
Running a restaurant means making financial decisions constantly, but you do not need to study every report every day to stay in control. The key is to build a reporting rhythm: check a small set of numbers each morning, review operating performance every Monday, and use month-end reports to understand profitability, cash flow, and the bigger financial picture.
Every morning, check yesterday's sales before making today's decisions
The first financial review of the day should be short. Before service begins, take a few minutes to understand what happened yesterday and whether anything needs attention.
Start with the daily sales report.
The daily sales report tells you whether the business is on track
A daily sales report shows how much revenue the restaurant generated during a specific business day. Depending on the POS system, it may break sales down by:
- Gross sales before discounts and adjustments.
- Discounts and promotions.
- Refunds and voids.
- Net sales after deductions.
- Sales tax collected.
- Tips collected.
- Number of transactions or checks.
- Average check size.
- Sales by dining room, takeout, or other service channels.
The distinction between gross sales and net sales matters. A restaurant can generate a substantial amount in gross sales but retain considerably less after discounts, refunds, and other adjustments.
For operating decisions, pay particular attention to net sales.
Compare yesterday's results with the same weekday from the previous week. Comparing a Tuesday with a Saturday rarely produces a useful conclusion because customer traffic and purchasing behavior can be very different.
Also compare actual sales with your budget or sales target, if you have one.
The decision this report triggers: Determine whether today's sales expectations need adjusting. If yesterday was unusually slow, consider whether purchasing, staffing, and food preparation for the next service should change. If sales were stronger than expected, check whether the kitchen and front-of-house teams have enough resources for the anticipated volume.
One slow day is not necessarily a problem. A repeated decline on the same weekday deserves investigation.
The payment summary shows where yesterday's money came from
The sales report tells you how much business you generated. The payment summary tells you how customers paid.
Review sales by payment method, including:
- Credit cards.
- Debit cards.
- Cash.
- Gift cards.
- Other accepted payment methods.
The payment mix matters because recorded sales and available cash are not the same thing.
Card transactions may be deposited according to a processor's settlement schedule. Cash should reconcile with the register. Gift card redemptions and other payment types should be recorded correctly.
Look for unexpected changes. If cash sales are unusually high, for example, verify that the register and recorded transactions agree. If card payments appear unusually low, check whether a terminal, payment integration, or transaction recording process failed.
The decision this report triggers: Investigate payment discrepancies before they become recurring reconciliation problems. Confirm that expected deposits and cash balances can be accounted for.
The register report helps catch problems before they repeat
The register or cash drawer report provides a closer look at what happened at the point of sale.
Depending on the system, it may include:
- Opening cash balance.
- Cash sales.
- Cash refunds.
- Cash paid out.
- Cash drops.
- Expected closing balance.
- Actual counted balance.
- Overages or shortages.
- Voided transactions.
This report is especially useful for restaurants with multiple cashiers or shifts.
Suppose the expected cash balance does not match the amount counted at closing. The difference should be investigated and documented rather than automatically treated as a harmless mistake.
Look for repeated patterns by register, cashier, shift, or day. A single discrepancy can be an error. The same discrepancy appearing repeatedly may indicate a training, procedure, or control problem.
The decision this report triggers: Decide whether a manager needs to investigate a register discrepancy, review a transaction, or reinforce cash-handling procedures.
Avoid making accusations based on a report alone. Verify the transactions and the closing process first.
The voids, discounts, and refunds report identifies revenue leakage
A restaurant can have healthy sales and still lose money through poorly controlled discounts, excessive refunds, and unnecessary voids.
Review these transactions every morning.
Pay attention to:
- Discounts applied without an obvious reason.
- Refunds that lack an explanation.
- Voids entered after an order was prepared.
- Repeated cancellations.
- Discounts concentrated around a particular shift.
- Manual price changes.
Not every discount is a problem. Promotions, customer recovery, employee meals, and authorized manager adjustments can all be legitimate.
The important question is whether each transaction has a valid reason and follows the restaurant's policies.
The decision this report triggers: Investigate unusual activity, correct authorization procedures, and determine whether a menu, service, or training issue is causing unnecessary refunds.
A pattern of refunds for one particular dish, for example, might point to inconsistent preparation rather than a cashier problem.
The daily labor report helps you plan the next shift
Although a complete labor analysis belongs in the weekly review, yesterday's labor information can reveal immediate scheduling problems.
Review:
- Hours worked by employee.
- Hours worked by department.
- Overtime hours.
- Scheduled versus actual hours.
- Labor dollars, if available.
- Labor cost as a percentage of sales.
The percentage is calculated as:
Labor cost percentage = Labor cost ÷ Net sales × 100
For example, if a restaurant records $1,200 in labor cost and $6,000 in net sales:
$1,200 ÷ $6,000 × 100 = 20%
This is a hypothetical example, not an industry benchmark.
Be careful when interpreting one day's labor percentage. Payroll timing, training shifts, unusual events, and differences in sales volume can distort daily comparisons.
The decision this report triggers: Determine whether the next schedule needs adjustment, whether overtime needs attention, or whether staffing levels were appropriate for actual demand.
The goal is not simply to cut hours. Understaffing can create slower service, mistakes, refunds, and lost sales.
Every morning, turn yesterday's numbers into three questions
A useful daily review does not require reading every available report.
Focus on three questions:
- Did the restaurant generate the sales we expected?
- Did the money recorded in the system reconcile with what was collected?
- Is there an operational problem that needs attention before the next service?
If the answer to all three is satisfactory, move on with the day.
If something looks unusual, assign someone to investigate it and set a deadline for reporting back.
A financial report is useful only when somebody acts on what it reveals.
Every Monday, review the previous week's performance as a complete operation
Daily reports help identify immediate problems. Weekly reports help you understand whether those problems are becoming patterns.
Monday is a practical day for this review because the previous week's transactions should be substantially complete, although payroll and accounting schedules may require additional time for final figures.
Set aside enough time to review the restaurant as a business, not just as a collection of individual shifts.
The weekly sales report shows which days are carrying the business
Start with sales by weekday.
A weekly sales report should show:
- Total net sales.
- Sales by day.
- Sales by service period, when available.
- Sales by channel.
- Number of transactions.
- Average check.
- Discounts and refunds.
- Comparison with the previous week.
- Comparison with the same week in a previous period, where useful.
The weekday breakdown is particularly important.
Imagine that total weekly sales increased, but most of the increase came from Friday and Saturday. Meanwhile, Monday through Thursday remained flat.
That tells a different story from a restaurant where sales increased consistently throughout the week.
Look for changes in customer traffic and average check size separately.
If transactions increase while average check decreases, you may be serving more customers but generating less revenue per customer. If transactions decrease while average check increases, fewer customers may be spending more.
These situations require different responses.
The decision this report triggers: Determine which days need operational attention, whether promotions are working, and whether opening hours or service arrangements deserve review.
Do not change the entire business strategy because of one unusual week. Look for repeated patterns.
The weekly product mix report shows what customers actually buy
The product mix report, sometimes called a menu sales report, breaks revenue and sales volume down by individual menu items.
For each item, review:
- Units sold.
- Sales revenue.
- Selling price.
- Discounts.
- Estimated or recorded ingredient cost, if available.
- Gross profit contribution, if available.
This report is particularly valuable because popular items are not automatically the most profitable items.
A burger might sell frequently but have relatively high ingredient costs. A side dish might sell less often but generate a stronger contribution per order.
Consider four questions:
- Which dishes sell the most?
- Which dishes generate the most revenue?
- Which dishes generate the most gross profit dollars?
- Which dishes are selling less than expected?
When you combine product mix with recipe costing, you can make more informed menu decisions.
For example, a dish with strong sales but weak gross profit may need a portion adjustment, supplier review, price change, or recipe revision.
A dish with low sales and low contribution may deserve a more serious review.
The decision this report triggers: Decide which items to promote, reprice, redesign, retain, or remove from the menu.
Before removing an item, consider its role in the menu. Some dishes attract customers or support sales of other products even when their individual margins are modest.
The weekly labor report reveals whether staffing matches demand
Labor is one of the major controllable operating expenses in a restaurant.
A weekly labor report should include total labor dollars and hours, preferably separated into departments such as:
- Kitchen.
- Servers.
- Hosts.
- Bartenders.
- Management.
- Dishwashing.
- Other support roles.
Calculate labor cost percentage using the same sales definition and labor-cost components each week.
Labor cost percentage = Total labor cost ÷ Net sales × 100
You should also review labor dollars independently.
A percentage can improve simply because sales increased, even if the restaurant added employees and spent more money on payroll.
Conversely, labor percentage can rise during a slow week even when managers did not add unnecessary hours.
Look at scheduled hours versus actual hours, overtime, employee availability, and sales by service period.
If lunch consistently has low traffic but the restaurant schedules the same staffing level as dinner, there may be an opportunity to adjust shift lengths.
If dinner regularly runs behind because the kitchen is understaffed, reducing hours further could make the problem worse.
The decision this report triggers: Adjust the next schedule, review overtime, redistribute hours between departments, or investigate productivity problems.
Confirm applicable wage, overtime, break, and scheduling requirements with the relevant state or city authorities or a qualified employment professional before changing labor practices.
The weekly purchasing report shows where inventory spending is going
Purchasing reports show what the restaurant ordered, from whom, in what quantities, and at what cost.
Review purchases by supplier and product category.
Useful information includes:
- Total purchases for the week.
- Purchases by supplier.
- Purchases by category.
- Unit prices.
- Price changes.
- Credits and returns.
- Outstanding invoices.
- Unusual purchasing activity.
Do not look only at the total amount spent.
A higher purchasing total may reflect a larger delivery, a price increase, an inventory buildup, or an actual increase in consumption.
Compare unit prices for important ingredients over time. If the price of a regularly purchased protein has increased, determine whether the menu price and recipe cost still make sense.
Also look for duplicate orders, unexpected quantities, and products purchased from multiple suppliers without a clear reason.
The decision this report triggers: Review supplier pricing, adjust purchasing quantities, investigate unusual orders, and identify opportunities to standardize buying procedures.
The goal is to purchase what the restaurant needs at a reasonable cost without creating unnecessary inventory or running out of essential ingredients.
The weekly food usage report connects purchases with actual consumption
Purchasing alone cannot tell you how much food the restaurant consumed.
For that, you need inventory information.
A basic food usage calculation is:
Food used = Beginning inventory + Purchases - Ending inventory
Suppose the restaurant started the week with $4,000 in food inventory, purchased $3,000 during the week, and ended with $3,500 in inventory.
Food used = $4,000 + $3,000 - $3,500
Food used = $3,500
All figures in this example are hypothetical US dollar amounts.
This calculation provides a more useful picture of food consumption than purchases alone.
You can then compare food usage with net food sales to estimate actual food cost percentage:
Actual food cost percentage = Food used ÷ Food sales × 100
If food used was $3,500 and food sales were $10,000:
$3,500 ÷ $10,000 × 100 = 35%
Again, these figures are hypothetical, not a recommended target.
For the comparison to be meaningful, inventory values, sales categories, and accounting periods must be consistent.
The decision this report triggers: Investigate differences between expected and actual consumption, review portion sizes, check waste records, and look for receiving or inventory-control problems.
The weekly cash flow report shows whether the business can meet upcoming obligations
Profit and cash are not interchangeable.
A restaurant may record strong sales and still struggle to pay suppliers, payroll, rent, or taxes because money has not arrived in the bank account or because large payments are coming due.
A weekly cash flow report should show:
- Beginning cash balance.
- Cash received.
- Supplier payments.
- Payroll payments.
- Rent and other operating payments.
- Loan payments.
- Tax payments.
- Ending cash balance.
- Expected near-term obligations.
Review upcoming payments, not just the current bank balance.
A restaurant with $20,000 in its bank account and $18,000 in obligations due shortly is in a different position from one with the same balance and no major payments scheduled.
The decision this report triggers: Determine whether payments need to be scheduled differently, whether collections require attention, or whether management should preserve additional working capital.
This report should help you anticipate cash pressure rather than discover it when a payment fails.
Every Monday, finish with a short list of actions and owners
The weekly financial review should produce decisions, not just observations.
For each problem, write down:
- What the report revealed.
- What needs to change.
- Who is responsible.
- When the change should happen.
- Which number will show whether it worked.
For example:
| Finding | Action | Responsible person |
|---|---|---|
| Food usage increased unexpectedly | Check portions and waste records | Kitchen manager |
| Monday sales declined repeatedly | Review opening schedule and local demand | General manager |
| Overtime increased | Review shift assignments | Operations manager |
| Supplier prices increased | Request updated quotations | Purchasing manager |
Keep the list short enough that the team can actually execute it.
You do not need a complicated financial meeting. You need a consistent process for turning information into action.
At month-end, read the Profit and Loss statement to understand profitability
The monthly review is where you step back from daily operations and examine whether the restaurant is making money.
The most important report is usually the Profit and Loss statement, also called the P&L or income statement.
It summarizes revenue, expenses, and the resulting profit or loss over a defined period.
A typical restaurant P&L includes several sections.
Revenue shows how much business the restaurant generated
Start with total revenue and its components.
Depending on your accounting setup, revenue may be separated into:
- Food sales.
- Beverage sales.
- Alcohol sales.
- Catering or other services.
- Other operating revenue.
Then account for discounts, refunds, and other adjustments to arrive at net revenue.
Make sure sales tax is not being treated as restaurant revenue when it is collected on behalf of the government.
Compare the current month with the previous month and the same month in the previous year, when reliable historical information is available.
Also compare actual results with your budget.
The decision this report triggers: Determine whether revenue is growing, declining, or shifting between categories, and whether the sales plan needs revision.
Cost of goods sold shows how much the restaurant spent on what it sold
Cost of goods sold (COGS) represents the direct cost of the food and beverages sold during the period.
For a restaurant, this generally includes ingredients and beverage products used in preparing customer orders.
The basic food cost calculation is:
Food cost percentage = Food cost ÷ Food sales × 100
For example, a restaurant records hypothetical monthly food sales of $40,000 and hypothetical food COGS of $13,000.
Food cost percentage = $13,000 ÷ $40,000 × 100
Food cost percentage = 32.5%
All figures in this example are hypothetical.
Be consistent about separating food and beverage sales and costs when reviewing each category.
A combined percentage can conceal problems in one category.
Also remember that purchases are not necessarily equal to COGS. Inventory changes must be considered when calculating the actual cost of products consumed.
The decision this report triggers: Review recipe costs, selling prices, purchasing, portion control, and inventory management.
If food cost increased, investigate the reason before changing menu prices. Supplier increases, waste, inaccurate inventory counts, and portion inconsistencies require different solutions.
Gross profit shows what remains after direct product costs
Gross profit is calculated by subtracting COGS from net revenue.
Gross profit = Net revenue - Cost of goods sold
Suppose a restaurant records hypothetical monthly net revenue of $50,000 and hypothetical COGS of $15,000.
Gross profit = $50,000 - $15,000
Gross profit = $35,000
Gross profit percentage is:
Gross profit percentage = Gross profit ÷ Net revenue × 100
$35,000 ÷ $50,000 × 100 = 70%
All figures are hypothetical.
Gross profit is important because it shows how much revenue remains to cover labor, occupancy, operating expenses, and other costs.
A restaurant can have strong sales and still struggle if its direct product costs consume too much revenue.
The decision this report triggers: Determine whether menu pricing, purchasing, and product mix are generating enough gross profit to support the operation.
Operating expenses show what it costs to keep the doors open
After gross profit, review operating expenses.
Common categories include:
- Salaries and wages.
- Payroll taxes and employee-related expenses.
- Rent.
- Utilities.
- Insurance.
- Repairs and maintenance.
- Cleaning supplies.
- Marketing.
- Software and administrative expenses.
- Professional services.
- Other operating costs.
Look for expenses that increased significantly compared with previous periods.
An increase is not automatically a problem. Utility costs may rise seasonally, repairs may be one-time expenses, and marketing costs may increase because of an intentional campaign.
The important question is whether the expense is understood, justified, and affordable.
Separate recurring expenses from unusual or one-time items when analyzing trends.
The decision this report triggers: Identify unnecessary recurring costs, review supplier and service contracts, and determine whether spending needs to be adjusted.
Net profit shows what the restaurant actually retained
After accounting for the relevant expenses, the P&L shows the resulting profit or loss.
The exact presentation depends on the accounting method and chart of accounts. Some statements show operating income, interest, depreciation, taxes, and net income separately.
Do not assume that positive sales or gross profit automatically mean the restaurant is profitable.
A business can generate $50,000 in monthly revenue and still lose money if its total costs exceed that amount.
The decision this report triggers: Decide whether the business is financially sustainable at its current sales level and cost structure.
If profitability is declining, identify the largest contributing expenses and investigate them individually.
Avoid making across-the-board cuts without understanding their operational consequences.
At month-end, review the balance sheet to understand what the restaurant owns and owes
The P&L explains performance over a period. The balance sheet shows the financial position of the business at a specific date.
It generally includes three main categories:
Assets: What the business owns or controls.
Examples include cash, accounts receivable, inventory, equipment, and other assets.
Liabilities: What the business owes.
Examples include supplier invoices, payroll obligations, taxes payable, loans, and other debts.
Equity: The owners' residual interest in the business after liabilities are deducted from assets.
The fundamental accounting equation is:
Assets = Liabilities + Equity
Pay attention to cash, inventory, outstanding supplier invoices, credit card liabilities, and debt balances.
A profitable restaurant can still face financial difficulties if liabilities are growing faster than available assets.
The decision this report triggers: Determine whether debt, unpaid bills, or inventory levels are putting pressure on the business and whether the restaurant has sufficient financial resources to operate comfortably.
Review the balance sheet with your bookkeeper or accountant if account balances do not make sense or have changed unexpectedly.
At month-end, review the cash flow statement to separate profit from available money
The cash flow statement explains how money moved into and out of the business during the reporting period.
It is generally divided into:
- Operating activities.
- Investing activities.
- Financing activities.
Operating activities include cash generated by restaurant operations and payments for everyday expenses.
Investing activities may include purchases or sales of equipment and other long-term assets.
Financing activities include borrowing, loan repayments, and owner contributions or distributions, depending on the reporting presentation.
This report helps explain why a restaurant can report a profit but have less cash available than expected.
For example, the restaurant may have purchased equipment, paid down debt, increased inventory, or experienced delays in customer payments.
The decision this report triggers: Determine whether the business needs to preserve cash, adjust payment timing, reduce unnecessary inventory, or reconsider planned capital expenditures.
For independent restaurant owners, this is especially important when planning renovations, equipment replacements, or expansion.
At month-end, compare actual results with the budget and previous periods
A financial report becomes more useful when you compare it with something.
Review the current month against:
- The monthly budget.
- The previous month.
- The same month last year, if available.
- The restaurant's recent operating trends.
Focus on differences rather than reading every line equally.
For example:
| Financial category | Budget (hypothetical) | Actual (hypothetical) | Difference |
|---|---|---|---|
| Net sales | $60,000 | $57,000 | -$3,000 |
| Food COGS | $18,000 | $19,000 | +$1,000 |
| Labor | $17,000 | $18,500 | +$1,500 |
| Rent | $5,000 | $5,000 | $0 |
| Utilities | $1,500 | $1,800 | +$300 |
All figures in this table are hypothetical US dollar amounts.
The numbers suggest three areas that deserve attention: lower-than-budgeted sales, higher food costs, and higher labor expenses.
However, the table does not explain why those differences occurred.
You need to investigate the underlying reports.
For example, lower sales may reflect fewer transactions, a lower average check, or a temporary interruption in service. Higher food costs may reflect supplier pricing, waste, or inventory adjustments.
The decision this report triggers: Revise the operating plan for the next month, assign corrective actions, and update financial expectations.
A budget is not useful if nobody compares it with actual performance.
At month-end, review accounts payable and receivable before committing to new spending
Accounts payable (AP) shows what the restaurant owes suppliers and other creditors.
Accounts receivable (AR) shows money owed to the restaurant.
For restaurants that primarily collect payment at the point of sale, accounts receivable may be relatively limited. However, catering, corporate accounts, private events, and other arrangements can create outstanding balances.
Review:
- Supplier invoices awaiting payment.
- Overdue invoices.
- Upcoming payment dates.
- Outstanding customer invoices.
- Uncollected event balances.
- Disputed charges or credits.
Look for invoices that appear twice, unexpected price changes, missing credits, and payments that have not been properly matched.
The decision this report triggers: Prioritize payments, follow up on outstanding balances, and avoid committing to new expenses without understanding upcoming cash requirements.
Confirm applicable tax, invoicing, and recordkeeping requirements with your accountant and relevant state or local authorities.
CounterChef can bring several restaurant reports into one review process
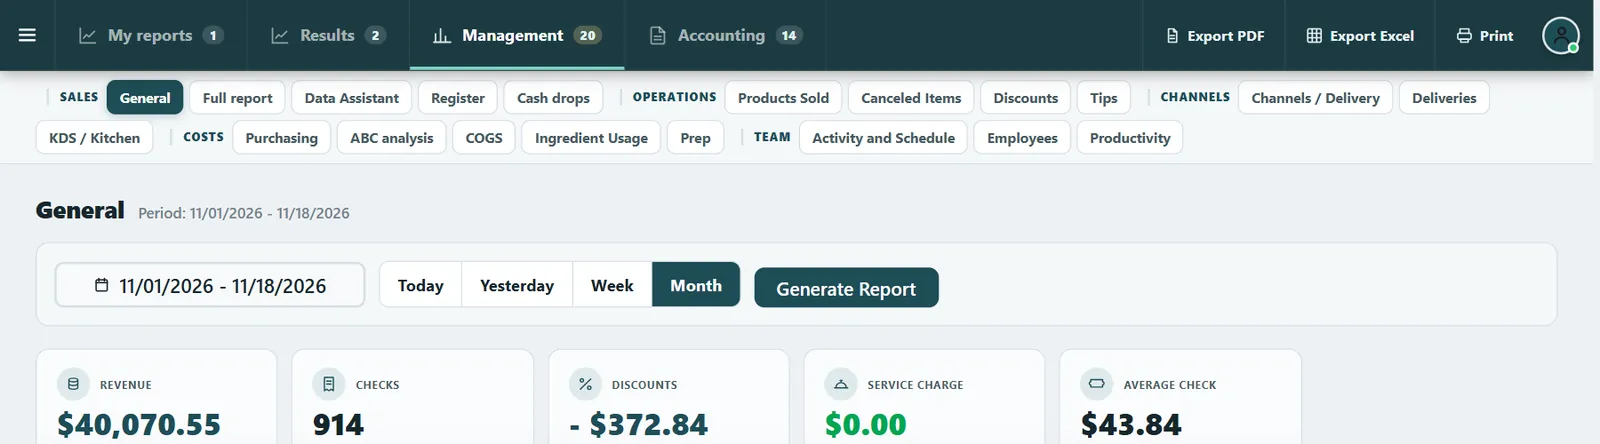
CounterChef provides reports covering sales, register, products, discounts, delivery, kitchen, purchasing, costs, and team, and these reports can be exported. Its owner dashboard shows sales by payment method and weekday against the previous period, while its Profit and Loss follows revenue, cost of goods, and gross margin for any period.
Build a reporting calendar your managers can actually follow
The best reporting process is one that happens consistently, even during busy weeks.
A practical schedule looks like this:
| Frequency | Reports to read | Main decision |
|---|---|---|
| Daily | Sales, payments, register, discounts, refunds, labor | Correct immediate problems |
| Weekly | Sales by weekday, product mix, labor, purchasing, food usage, cash flow | Adjust operations and purchasing |
| Monthly | Profit and Loss, balance sheet, cash flow, budget comparison, AP and AR | Improve profitability and financial stability |
Give each review a defined owner.
The general manager might prepare daily sales and labor reports. The kitchen manager might review product usage, purchasing, and waste. The owner or bookkeeper should oversee the monthly financial statements.
For smaller restaurants, one person may handle several responsibilities. What matters is that every report has someone responsible for reviewing it.
Keep a record of important decisions and revisit them during the next reporting cycle.
If you reduced purchasing quantities to address excess inventory, for example, check the next weekly inventory report to see whether the change worked.
If you adjusted the schedule because of low weekday sales, compare labor hours and sales on those weekdays during the following weeks.
This creates a feedback loop: review, decide, act, and measure.
Frequently asked questions
Which financial reports should a restaurant owner check every day?
Start with the daily sales report, payment summary, register reconciliation, discounts and refunds report, and a basic labor report.
These reports help you understand sales performance, verify transactions, identify unusual activity, and prepare for the next service.
You do not need to review the complete Profit and Loss statement every morning. Save the detailed profitability analysis for the monthly review.
How often should a restaurant owner review the Profit and Loss statement?
At least once a month is a practical starting point for most independent restaurants.
A monthly P&L gives you enough information to evaluate revenue, cost of goods sold, gross profit, operating expenses, and overall profitability.
Some owners also review preliminary weekly financial summaries, particularly when sales or costs are changing quickly. However, monthly accounting figures should be reconciled before being treated as final.
What is the difference between a restaurant sales report and a Profit and Loss statement?
A sales report focuses on revenue generated through restaurant operations. It typically includes sales by day, product, payment method, or service channel.
A Profit and Loss statement goes further. It includes revenue, cost of goods sold, operating expenses, and the resulting profit or loss.
A restaurant can have a strong sales report and a weak P&L because high sales do not guarantee that the business is covering its costs.
Can a restaurant be profitable but still run out of cash?
Yes.
Profitability and cash flow measure different things. A restaurant may report a profit but have insufficient available cash because of supplier payments, loan repayments, equipment purchases, inventory increases, or other financial commitments.
That is why restaurant owners should review both the Profit and Loss statement and cash flow reports.
The P&L tells you whether the business is making money over a period. Cash flow tells you whether money is available when the business needs to pay its bills.
Related feature: Reports.