
Restaurant Labor Cost Percentage: Find the Expensive Shift, Not Just the Monthly Average
Restaurant labor cost percentage tells you how much of your sales revenue goes toward paying the people who run your restaurant. But the monthly number alone can hide an expensive Tuesday lunch, a slow Sunday closing crew, or a schedule that puts too many people on the floor before sales arrive.

The useful way to manage labor is to break it down by day, daypart, and role, then compare scheduled hours with actual demand so you can fix the shift without damaging service.
Calculate labor cost percentage using the same sales and payroll window
The basic formula is straightforward:
Labor cost percentage = Total labor cost ÷ Net sales × 100
Use net sales consistently: sales after discounts and refunds, excluding sales tax collected for the government. Decide whether your reporting also excludes tips and other pass-through amounts, and keep that definition consistent week after week.
For example, if labor costs $4,800 and net sales are $16,000:
- Labor cost: $4,800
- Net sales: $16,000
- Calculation: $4,800 ÷ $16,000 × 100
- Labor cost percentage: 30%
That is the overall ratio. The calculation itself is easy; the important part is making sure the labor and sales figures belong to the same period and represent the same operating activity.
If you compare payroll for Monday through Sunday with sales from Tuesday through Monday, your ratio will be misleading. If payroll is recorded when paid rather than when earned, pay-period timing can also distort the weekly view.
For operational decisions, assign labor to the days employees actually worked. Use a consistent weekly cutoff, and reconcile the operational view with your payroll records.
Include the labor expenses that actually belong to the operation
A useful labor report should not stop at hourly wages. The full cost of employing your team is higher than the amount appearing on the schedule.
Depending on your accounting method, employment structure, and jurisdiction, include:
- Hourly wages for kitchen, counter, bar, dining room, dishwashing, cleaning, and other hourly staff.
- Salaries for managers, chefs, supervisors, and other salaried employees whose work supports restaurant operations.
- Overtime premiums.
- Employer payroll taxes.
- Employer-paid benefits, including applicable insurance, retirement contributions, and other benefits.
- Workers' compensation costs.
- Paid training and orientation hours.
- Paid time off and other paid leave.
- Bonuses and other compensation attributable to the period, when applicable.
Keep employee tips separate from employer labor expense unless your accounting treatment specifically includes them for the metric you're using. Tips received by employees are not automatically a wage expense paid by the restaurant, although applicable rules concerning tip credits, payroll reporting, and employer obligations vary.
Also avoid counting the same expense twice. If your payroll report already includes employer taxes, do not add those taxes again from another accounting report.
You may want to track two versions:
Direct wage percentage: wages and salaries divided by net sales.
Fully loaded labor percentage: wages, salaries, payroll burden, benefits, and other applicable employment costs divided by net sales.
The direct wage figure is useful for managing schedules. The fully loaded figure is more useful for understanding what labor actually costs the business.
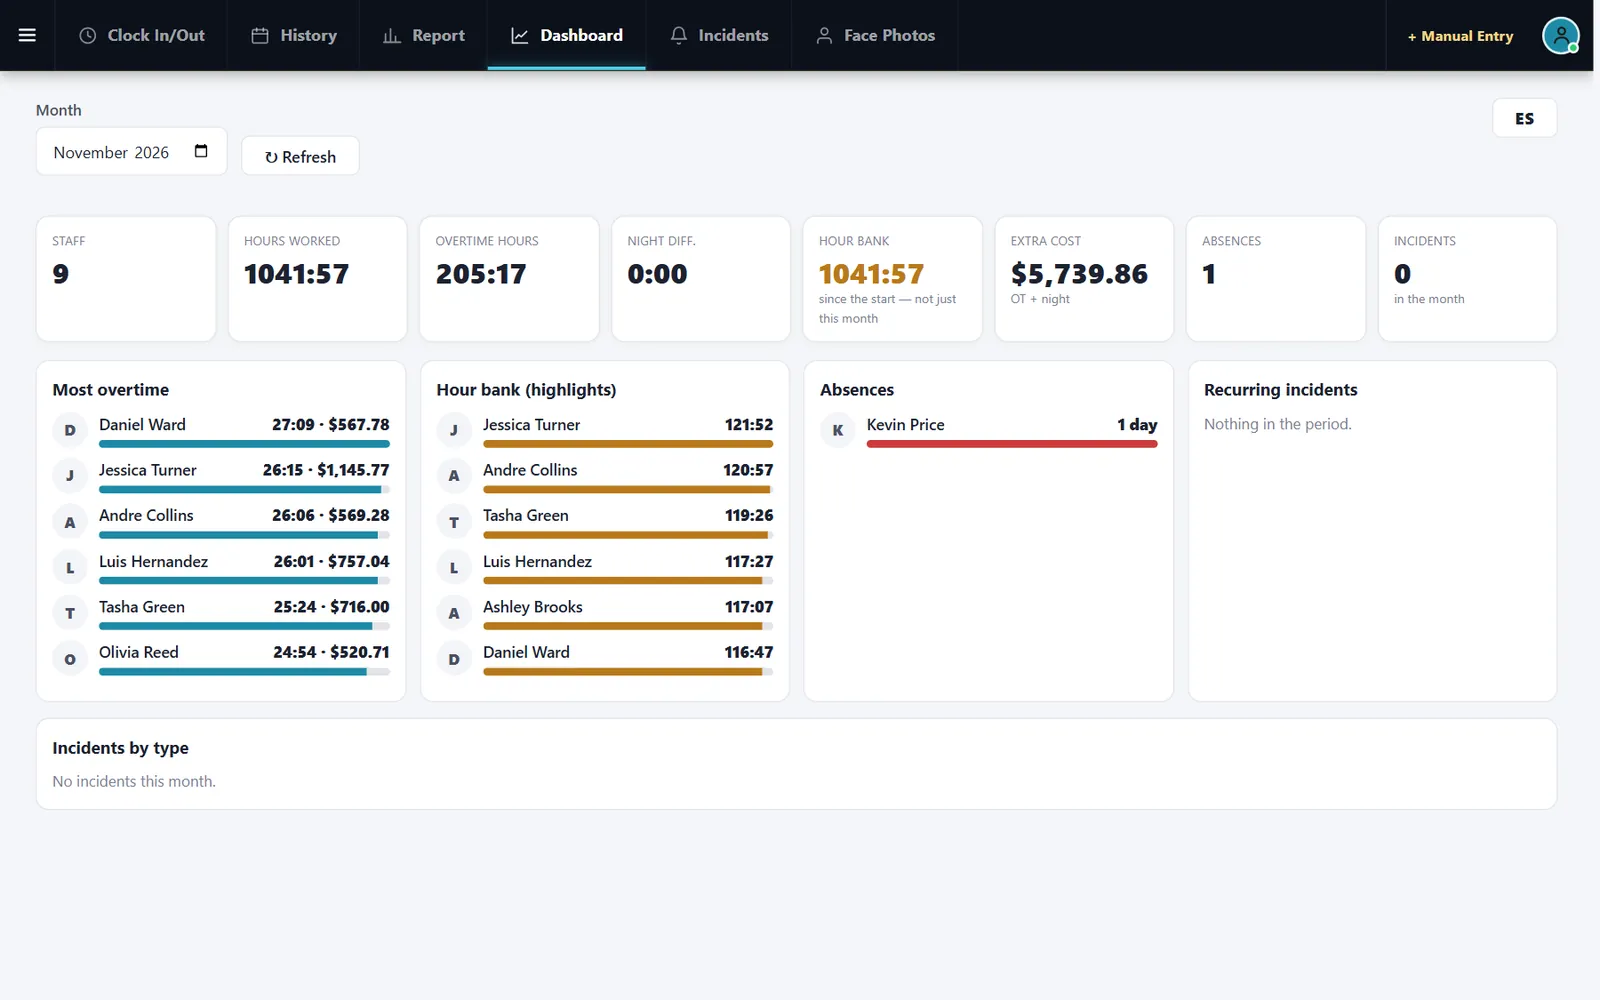
Break the number down by daypart before changing the schedule
A restaurant can have an acceptable weekly labor percentage and still have several poorly staffed shifts.
Think about the business in operating blocks: breakfast, lunch, afternoon, dinner, late night, or whatever dayparts fit your concept. Assign employees' working hours and labor costs to the block in which those hours were worked.
A daypart report should show at least:
| Daypart | Net sales | Labor cost | Labor % | Hours |
|---|---|---|---|---|
| Breakfast | $ | $ | % | Hours |
| Lunch | $ | $ | % | Hours |
| Afternoon | $ | $ | % | Hours |
| Dinner | $ | $ | % | Hours |
| Late night | $ | $ | % | Hours |
These are blank reporting fields, not benchmarks.
This matters because each daypart has a different workload. A lunch shift may require fast ticket production and a short staffing window. Dinner may need more servers, cooks, bartenders, and support staff because guests stay longer and orders are more complex. A quiet afternoon may still need a minimum crew to prepare for dinner.
A good daypart comparison asks:
- Did sales arrive when the schedule expected them?
- Was the crew productive during the peak?
- How much paid time was spent before opening or after the last customer?
- Did the shift need extra help because of a callout?
- Were employees doing useful prep during slow periods?
- Did a staffing reduction increase ticket times, errors, or complaints?
The objective isn't to make every daypart have the same percentage. It's to understand why each shift costs what it costs.
Use role-level labor to find where the schedule is leaking
Daypart reporting tells you when labor is expensive. Role-level reporting tells you where it may be expensive.
Separate hours and costs by roles such as:
- Line cooks
- Prep cooks
- Dishwashers
- Servers
- Hosts
- Bartenders
- Counter staff
- Shift managers
- Cleaning and support staff
Some employees perform multiple jobs during one shift. Allocate their time by actual activity when you can, or use a consistent practical allocation method. Don't pretend the split is exact if it isn't.
A kitchen-heavy lunch may have a high labor percentage because cooks and prep staff are required before sales begin. A dining room may look expensive because too many servers are scheduled for the first hour. A manager may be working a floor shift while also doing ordering and administrative work.
Those are different problems and require different solutions.
When a role looks expensive, look at its workload before cutting hours. For example, a dishwasher may have relatively little work during the first half of dinner but become overwhelmed at the peak. Moving the start time may solve the problem more effectively than shortening the shift.
A worked example shows how one overstaffed shift hides inside a good average
The following restaurant, staffing, sales, wages, and expenses are entirely hypothetical. All figures are illustrative and are not industry statistics or recommended targets.
Imagine a neighborhood restaurant operating five dayparts across a hypothetical week.
| Daypart | Hypothetical net sales | Hypothetical labor cost | Labor % |
|---|---|---|---|
| Monday lunch | $1,800 | $540 | 30.0% |
| Tuesday lunch | $2,200 | $660 | 30.0% |
| Wednesday dinner | $4,000 | $1,000 | 25.0% |
| Thursday dinner | $4,500 | $1,125 | 25.0% |
| Friday dinner | $7,500 | $1,875 | 25.0% |
| Total | $20,000 | $5,200 | 26.0% |
The hypothetical weekly labor percentage is:
$5,200 ÷ $20,000 × 100 = 26.0%.
That overall figure may look reasonable to the owner, but let's examine Tuesday lunch.
Tuesday's hypothetical labor cost of $660 consists of:
| Hypothetical role | Hours | Hourly rate | Cost |
|---|---|---|---|
| Line cooks | 16 | $18 | $288 |
| Prep cook | 6 | $17 | $102 |
| Servers | 12 | $12 | $144 |
| Dishwasher | 6 | $16 | $96 |
| Shift manager | 2 | $15 | $30 |
| Total | 42 | $660 |
The hypothetical Tuesday lunch generated $2,200 in net sales with 42 paid labor hours.
Now suppose the owner reviews the sales pattern and finds that two servers were scheduled to arrive early, but the early seating was consistently quiet. The owner also finds that prep tasks were being completed by a separate prep cook during hours when the line crew had spare capacity.
A hypothetical adjustment:
- Remove 2 server hours at $12 per hour: $24.
- Move 2 prep hours at $17 per hour to a period when prep is genuinely needed, rather than paying for them during the quiet lunch window: $34 shifted, not automatically eliminated.
- Potentially eliminate $24 of paid labor from the lunch window if the work is not needed elsewhere and the staffing change is operationally safe.
If lunch labor cost falls from $660 to $636 while sales remain $2,200, the new hypothetical lunch percentage is:
$636 ÷ $2,200 × 100 = 28.91%.
The hypothetical improvement is 1.09 percentage points.
The weekly result, if that $24 is truly removed from the week's labor cost and sales stay unchanged, becomes:
$5,176 ÷ $20,000 × 100 = 25.88%.
The weekly ratio barely moves. But the lunch shift is more efficient, and the owner has identified a specific schedule change instead of cutting staff indiscriminately.
If the prep hours are moved rather than eliminated, the owner should evaluate whether they improve the dinner shift, avoid overtime, or replace other scheduled hours. Simply moving labor around is not a labor-cost reduction unless it produces a measurable benefit.
Compare scheduled hours with actual demand instead of relying on the weekly percentage
Your schedule is a forecast. Your time clock is what actually happened.
Every week, compare these four numbers for each daypart:
- Scheduled labor hours.
- Actual labor hours.
- Forecast net sales.
- Actual net sales.
This reveals two common situations that the monthly report misses.
Situation one: Sales missed the forecast. You staffed for $3,000 in sales, but the shift generated $2,300. Even if everyone worked their scheduled hours, labor percentage increased because sales were lower.
Situation two: Labor exceeded the schedule. You forecast $3,000 in sales and achieved it, but employees stayed late, took extra shifts, or arrived early. Sales were fine, but the labor cost was higher than planned.
Track the difference in hours and dollars, not just the percentage. A shift that ran 4 extra hours at a hypothetical average loaded cost of $20 per hour has $80 of unplanned labor cost. You can investigate that $80 much more easily than a vague increase in your monthly ratio.
Try these five labor improvements this week
These are small operational experiments that can reveal scheduling opportunities without immediately reducing headcount.
1. Build a 30-minute staffing map for your busiest day
Take last week's busiest day and divide it into 30-minute blocks.
Write down how many people were working in the kitchen, dining room, bar, and support areas. Add sales, order volume, or ticket volume for each block if available.
Look for a mismatch: perhaps six employees were present before the rush, but the actual peak started an hour later than expected.
Change one start time next week and compare the result. Don't redesign the entire schedule based on one observation.
2. Assign slow-period work before the shift begins
Slow periods become expensive when employees are waiting for a manager to find something useful to do.
Create a short task list for each role that can be completed during a quiet period without compromising customer service:
- Portion ingredients for the next rush.
- Restock service stations.
- Clean equipment that is safe to clean while operating.
- Label and rotate inventory.
- Prepare backup supplies.
- Complete assigned side work.
Make tasks specific and time-bounded. "Clean the kitchen" is vague. "Restock the sauté station, label the backup sauces, and clean the reach-in handles" is actionable.
This turns idle time into useful production without adding another person to the schedule.
3. Track the cost of the first and last hour separately
Opening and closing labor can quietly become a habit.
For one week, record how many employees are clocked in during the first hour before opening and the last hour after closing. Identify what each person is actually doing.
If the opening crew is spending 45 minutes waiting for deliveries or equipment, investigate the sequence. If the closing crew finishes their assigned work at different times, stagger departure times rather than keeping everybody on the clock until the last person finishes.
Do not shorten required cleaning, food safety, cash handling, or security procedures. The goal is to remove waiting and overlap, not necessary work.
4. Use a labor exception log instead of debating the schedule
When a shift exceeds its labor plan, record the reason while it is still fresh.
A simple list works:
| Date | Daypart | Extra labor | Reason | Corrective action |
|---|---|---|---|---|
| Tuesday | Lunch | 2 hours | Sales below forecast | Adjust arrival time |
| Friday | Dinner | 3 hours | Callout coverage | Cross-train backup |
| Saturday | Closing | 1 hour | Cleanup ran late | Review task sequence |
The examples are hypothetical.
Review this log weekly. If the same issue appears repeatedly, it deserves a schedule or process change. If the cause is genuinely unpredictable, you may need to accept it as part of operating the restaurant.
5. Cross-train for bottlenecks, not for the sake of a training list
Cross-training is valuable when it solves a real scheduling problem.
A counter employee who can handle basic expo duties during a rush may help avoid scheduling a separate position for a short period. A prep cook trained on a particular station may cover an absence without creating overtime elsewhere.
Choose one bottleneck and train one backup this week. Define what that employee can safely and competently perform, then schedule practice during a manageable period.
Do not use cross-training as a reason to assign incompatible responsibilities simultaneously or leave a critical station unattended.
Decide whether the problem is wages, hours, sales, or workflow
A rising labor percentage does not always mean you have too many employees.
Use this diagnostic:
| What changed? | Likely issue to investigate |
|---|---|
| Labor dollars increased, sales stayed flat | Hours, overtime, wage changes, benefits, or payroll burden |
| Labor dollars stayed flat, sales fell | Demand, weather, promotions, traffic, or sales mix |
| Hours increased, sales increased less | Productivity, staffing timing, workflow, or role allocation |
| Overtime increased | Schedule coverage, shift overlap, callouts, or workload |
| Labor is high before opening | Prep sequence, deliveries, equipment readiness, or start times |
| Labor is high after closing | Closing assignments, cleaning workflow, or departure timing |
| Labor is high in one role | Bottleneck, training, task allocation, or demand mismatch |
A labor percentage can rise simply because revenue falls. If you cut staff to compensate for a sales decline without understanding the workload, you may create slower service, more errors, lost repeat visits, and additional overtime.
When considering a reduction, ask: What work will disappear, what work will move to another employee, and what service outcome could deteriorate?
Use a weekly labor review that takes 15 minutes
You do not need a complicated presentation. A short, consistent review is more useful than an occasional deep dive.
Every Monday, pull last week's labor and sales by daypart and role. Identify the largest dollar variance, not just the worst percentage.
Then answer:
- Which shift had the largest labor-dollar overrun?
- Which daypart had the biggest sales miss?
- Which role had the most unplanned hours?
- Did overtime or callouts contribute?
- What one schedule or workflow change will we test?
- Who owns the change?
- When will we review the result?
Set a limit of one or two experiments for the next week. If you change arrival times, staffing levels, menu prep, and closing procedures all at once, you will struggle to identify what actually improved.
Keep the labor report connected to the work happening in the restaurant
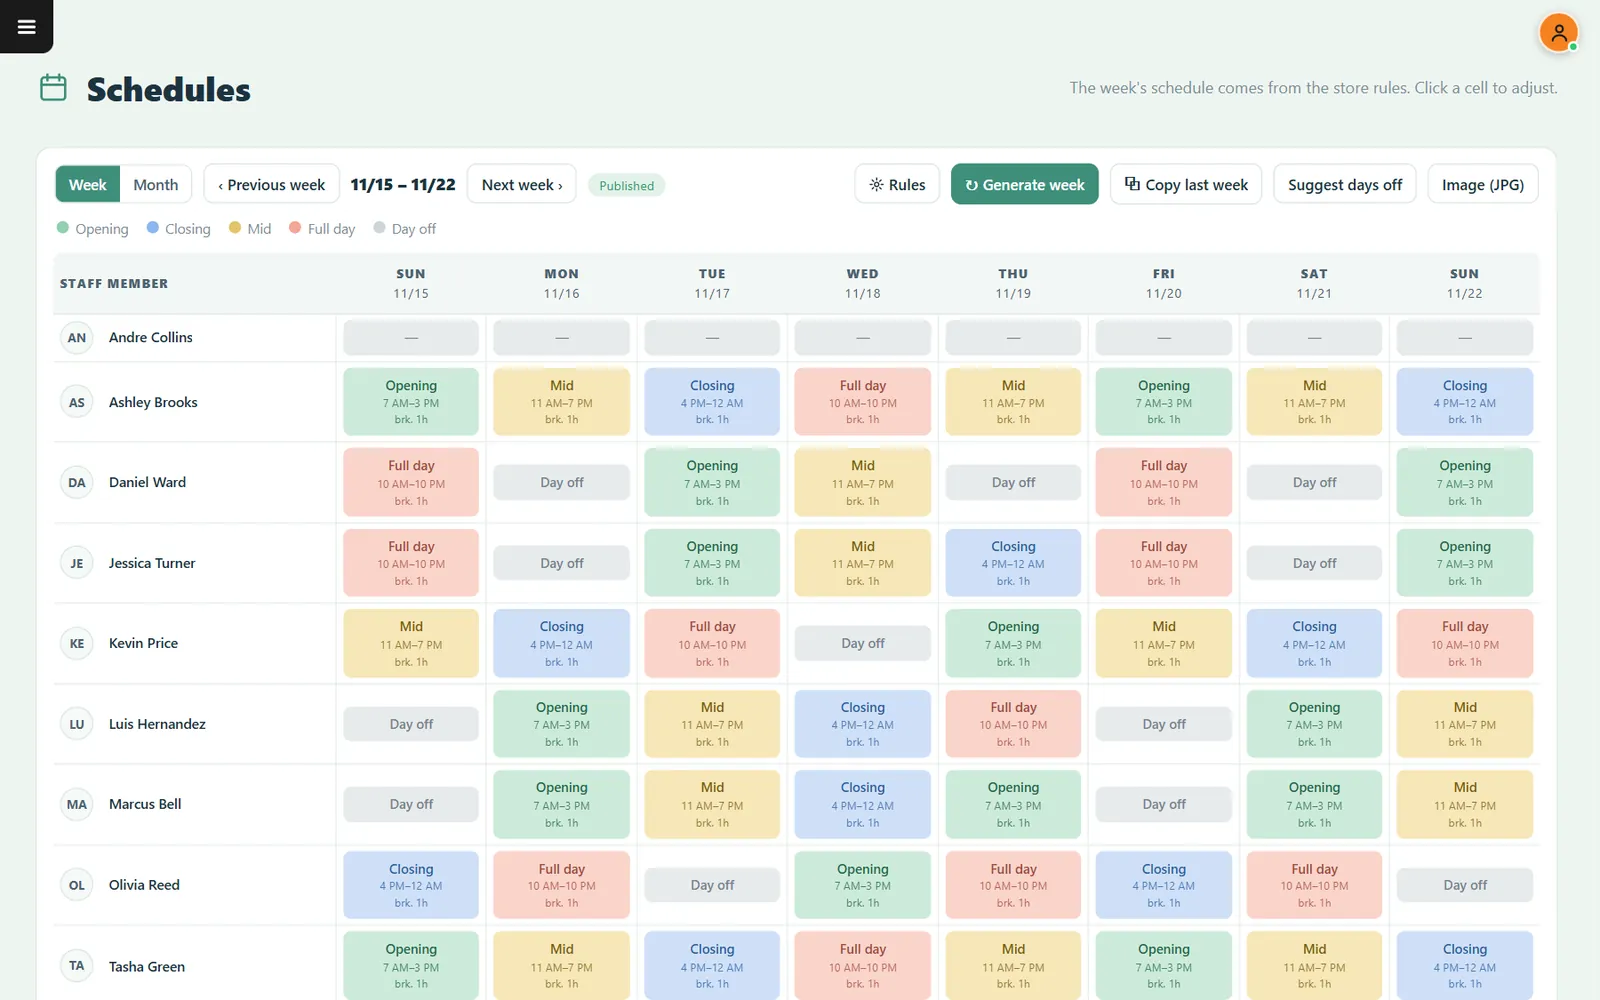
A POS and scheduling system can make this review easier when sales, employee time, and staffing schedules are recorded consistently.
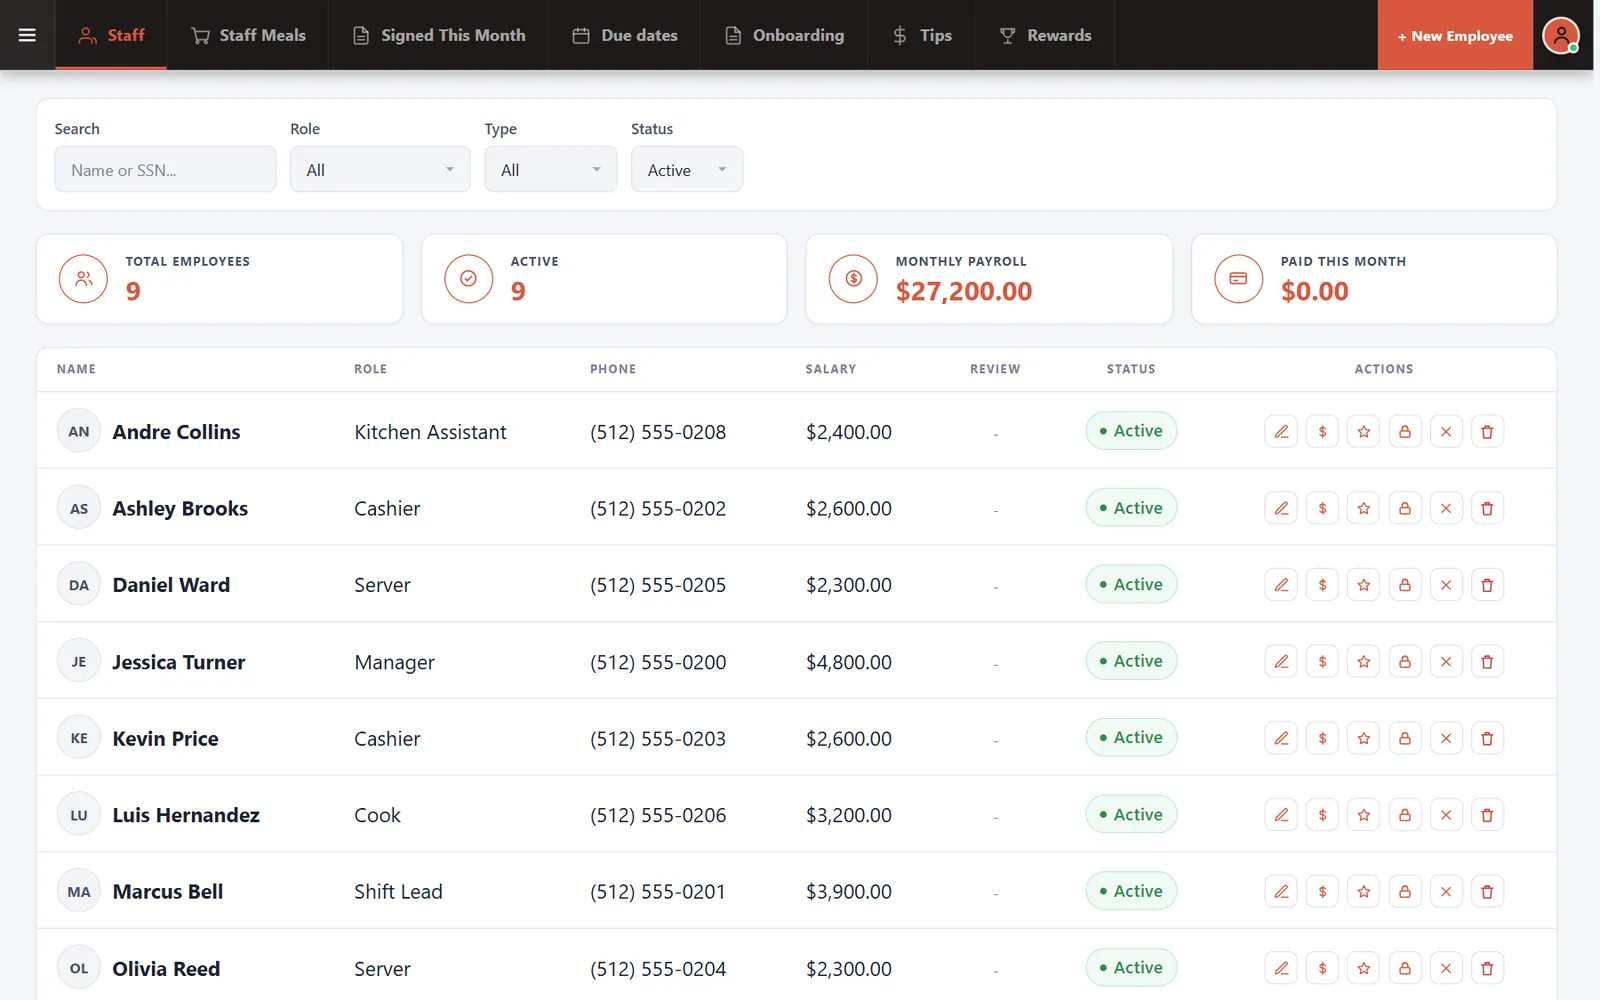
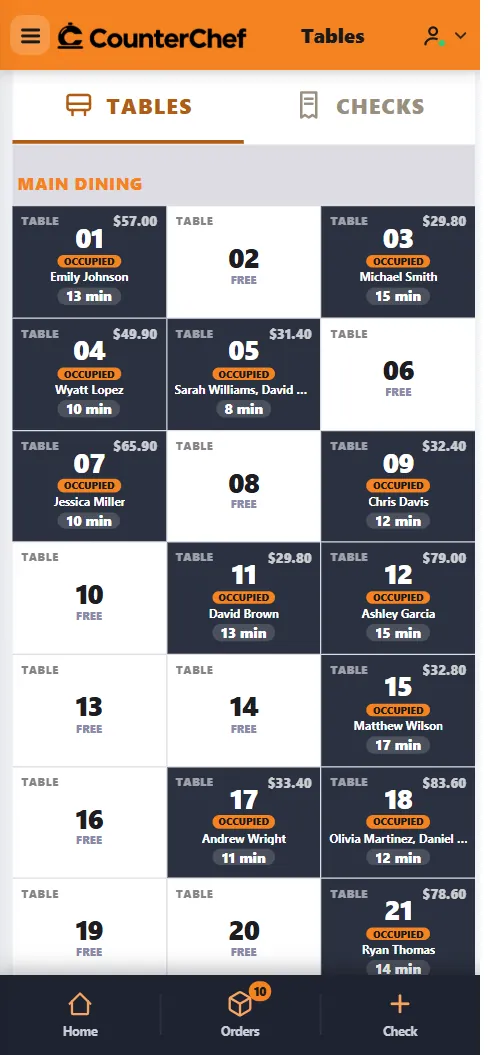
CounterChef runs on iPad, Android tablet, iPhone, and computer; employees clock in on a tablet or computer, and schedules are built in the system. Its reports can be viewed by day, item, and employee, while kitchen ticket timers can help operators examine service timing alongside staffing decisions.
Use your reporting tools to identify patterns, then validate them on the floor. A report can show that a shift ran long; watching the closing sequence can reveal why.