
How to Calculate Coffee Shop Profit Margin: Start With One Latte, Then Build the Monthly Numbers
Your coffee shop profit margin is not determined by how much you charge for a latte or how cheap you can buy coffee beans. It comes down to what each drink actually costs to make, how much customers spend per visit, and how many labor hours you need to generate that revenue.
The most useful way to understand your numbers is to cost one latte completely, including its cup, lid, milk waste, and preparation time. Then follow that drink through a full month to see how ticket size and staffing decisions affect what you keep.
Start by separating gross margin from net profit margin
Coffee shop owners sometimes use profit margin to describe several different things. Keep them separate when reviewing your business.
Gross profit margin measures what remains after subtracting the direct cost of the products sold.
For a coffee shop, this usually means coffee beans, milk, syrups, other ingredients, and disposable packaging.
The formula is:
Gross profit margin = (Sales revenue - Cost of goods sold) / Sales revenue x 100
If your shop sells $10,000 in drinks and food and the ingredients and packaging cost $3,000, the calculation is:
($10,000 - $3,000) / $10,000 x 100 = 70%.
That is a 70% gross profit margin.
However, you have not paid your baristas, covered rent, paid utilities, or accounted for insurance, repairs, and other operating expenses.
Operating profit margin measures what remains after operating expenses are deducted.
Net profit margin measures what remains after all applicable expenses, including interest and taxes, are accounted for.
When evaluating your coffee shop, track all three where your accounting setup allows. A strong gross margin does not automatically mean a profitable business.
Cost one latte down to every ingredient and disposable item
Let's work through a latte because it combines several costs that owners sometimes overlook.
The recipe might look simple:
- Double espresso.
- Steamed milk.
- Optional flavor syrup.
- One takeaway cup.
- One lid.
- One sleeve.
- A napkin.
But the cost is not simply the price of the espresso beans plus the milk poured into the pitcher.
You also need to account for preparation losses, discarded milk, inconsistent portions, and packaging.
Consider this hypothetical costing exercise.
Hypothetical latte cost breakdown
Assume the following purchasing and recipe details:
| Item | Hypothetical calculation | Cost |
|---|---|---|
| Coffee beans | 18 grams from a $20/kg bag | $0.36 |
| Milk poured into drink | 8 oz from milk costing $0.04/oz | $0.32 |
| Milk waste allowance | 1 oz per drink at $0.04/oz | $0.04 |
| Sugar or syrup | Measured portion | $0.08 |
| Takeaway cup | One cup | $0.12 |
| Lid | One lid | $0.05 |
| Sleeve | One sleeve | $0.04 |
| Napkin | One napkin | $0.02 |
| Total | $1.03 |
Every figure in this example is hypothetical.
Notice that milk waste is included separately. If you pour too much milk into the pitcher and discard the remainder, that milk still costs money.
The same applies to espresso. A poorly calibrated grinder, inconsistent dosing, or shots discarded during preparation can increase actual bean consumption.
For this example, assume the latte sells for $5.00.
The gross profit dollars are:
$5.00 - $1.03 = $3.97.
The gross profit margin is:
$3.97 / $5.00 x 100 = 79.4%.
That number looks attractive, but it is not the money you take home.
It excludes the barista's time, payroll expenses, occupancy costs, utilities, equipment maintenance, and other overhead.
Include labor without confusing it with ingredient cost
Suppose a barista earns a hypothetical $18 per hour and spends an average of three minutes preparing and handing over each latte.
Three minutes is 0.05 hours.
The direct labor allocation is:
$18 x 0.05 = $0.90.
Your latte now has the following contribution after ingredients, packaging, and allocated preparation labor:
$5.00 - $1.03 - $0.90 = $3.07.
This is a more useful figure for understanding how individual products contribute toward the shop's operating expenses.
It is still an allocation, not a complete labor-cost calculation. Actual payroll costs can include employer taxes, benefits, paid breaks, training, cleaning, opening, closing, and time between orders.
Measure milk waste instead of guessing at it
Milk waste is one of the easiest costs to underestimate in a coffee shop.
A barista may pour more milk than necessary because the pitcher is easier to steam when it contains extra liquid. Another may prepare a larger pitcher during a rush and discard what remains.
Neither decision looks particularly expensive when viewed as one drink.
Across a month, the total can become meaningful.
Try a simple seven-day milk-waste audit this week.
- Record how much milk is opened each day.
- Record how much milk is used in sold drinks based on standard recipes.
- Measure or estimate milk discarded during steaming and preparation.
- Record expired milk separately.
- Compare actual milk consumption against the amount your recipes should require.
Do not automatically blame the baristas. Your pitcher sizes, drink recipes, rush patterns, and station setup may be contributing to the problem.
One practical change is to create a pitcher guide for each drink size. Show the expected fill level and the correct amount of milk for each recipe.
Another is to separate milk waste into two categories: preparation waste and expiration waste. They have different causes and require different fixes.
Preparation waste might improve with better training. Expiration waste might require smaller orders or a different inventory rotation.
Calculate your monthly coffee shop profit margin
Now take the latte costing exercise and turn it into a monthly operating example.
The following figures are entirely hypothetical. They are designed to demonstrate the calculations, not represent an industry average.
Assume a small independent coffee shop operates for 26 days per month.
| Monthly item | Hypothetical amount |
|---|---|
| Monthly transactions | 3,000 |
| Average ticket | $8.00 |
| Total sales | $24,000 |
| Ingredients and packaging | $6,000 |
| Gross profit | $18,000 |
| Labor, including applicable payroll costs | $7,200 |
| Rent | $2,500 |
| Utilities | $600 |
| Insurance | $300 |
| Repairs and maintenance | $250 |
| Other operating expenses | $850 |
| Total operating expenses excluding COGS | $11,700 |
Calculate gross profit:
$24,000 - $6,000 = $18,000.
Calculate gross profit margin:
$18,000 / $24,000 x 100 = 75%.
Calculate operating profit:
$18,000 - $11,700 = $6,300.
Calculate operating profit margin:
$6,300 / $24,000 x 100 = 26.25%.
Hypothetical monthly operating profit margin: 26.25%
This example assumes the listed expenses include all relevant operating costs for the calculation. It does not automatically represent net profit after interest, taxes, or other non-operating items.
The important point is that your coffee shop has two separate challenges.
You need to make money on the products you sell, and you need to operate the business efficiently enough to retain a reasonable portion of that gross profit.
See how a larger average ticket changes the month
A coffee shop can increase revenue without necessarily attracting more customers.
One way is to increase the average ticket.
Imagine the hypothetical shop above keeps its 3,000 monthly transactions but increases its average ticket from $8.00 to $9.00.
Monthly revenue becomes:
3,000 x $9.00 = $27,000.
For this illustration, assume the additional $3,000 in sales comes from add-on products with a hypothetical 30% ingredient and packaging cost.
The additional cost of goods sold is:
$3,000 x 30% = $900.
The revised monthly figures become:
| Item | Original | Revised |
|---|---|---|
| Transactions | 3,000 | 3,000 |
| Average ticket | $8.00 | $9.00 |
| Revenue | $24,000 | $27,000 |
| COGS | $6,000 | $6,900 |
| Gross profit | $18,000 | $20,100 |
| Operating expenses | $11,700 | $11,700 |
| Operating profit | $6,300 | $8,400 |
| Operating profit margin | 26.25% | 31.11% |
These figures are hypothetical and assume no additional staffing or other operating expenses.
The extra $1 per transaction generates $2,100 in additional operating profit.
That is why ticket size deserves attention.
However, do not increase the average ticket by simply pushing customers toward expensive products. Build combinations that make sense.
For example:
- Offer a latte with a pastry as a clearly priced breakfast combination.
- Train baristas to ask whether customers want an additional espresso shot.
- Display packaged coffee near the register.
- Make the pastry case visible before customers reach the payment terminal.
Track the gross profit dollars from these additions, not just the number sold.
A $2 add-on with a high ingredient cost may contribute less than a $1 add-on with a lower cost.
Understand how staffing hours change monthly profit
Labor is often the expense that makes the biggest difference between a coffee shop that looks profitable on paper and one that struggles to retain cash.
The challenge is that coffee demand is uneven.
You may have a busy morning rush, a quiet afternoon, and another short increase in traffic near closing.
Staffing the entire day as if every hour has the same demand creates unnecessary labor costs.
Return to the hypothetical monthly example:
- Revenue: $24,000.
- Gross profit: $18,000.
- Labor: $7,200.
- Other operating expenses: $4,500.
- Operating profit: $6,300.
Now assume the owner identifies overlapping shifts during quiet afternoon periods.
The shop removes 40 unnecessary paid labor hours per month at a hypothetical fully loaded labor cost of $20 per hour.
Monthly labor savings:
40 x $20 = $800.
Revised labor expense:
$7,200 - $800 = $6,400.
Revised operating profit:
$6,300 + $800 = $7,100.
Revised operating profit margin:
$7,100 / $24,000 x 100 = 29.58%.
This hypothetical change improves operating profit margin from 26.25% to 29.58%.
But be careful about where you cut hours.
If fewer employees create longer lines, missed orders, poor cleaning, or slower service, you may lose more revenue than you save.
A better approach is to compare staffing hours with transactions by hour.
Use a staffing-by-hour worksheet
Copy this table and complete it using your POS reports and payroll records.
| Time period | Transactions | Paid staff hours | Problem to investigate |
|---|---|---|---|
| Opening | Too much setup time? | ||
| Morning rush | Long queues? | ||
| Late morning | Overlapping shifts? | ||
| Afternoon | Unproductive coverage? | ||
| Closing | Excessive closing time? |
Look for periods where staffing hours increase without a corresponding increase in sales or necessary operational work.
Also distinguish between productive customer-facing time and essential non-selling work. Cleaning, receiving inventory, preparation, and closing duties still need to happen.
Confirm scheduling, overtime, breaks, and other employment requirements with your state or city and an appropriate employment professional.
Watch the relationship between ticket size and labor productivity
Average ticket and staffing hours should never be evaluated independently.
Suppose your hypothetical coffee shop generates $24,000 in monthly revenue and schedules 600 paid labor hours.
Revenue per labor hour is:
$24,000 / 600 = $40.
Now imagine the shop increases monthly sales to $27,000 without increasing its 600 labor hours.
Revenue per labor hour becomes:
$27,000 / 600 = $45.
That is a 12.5% improvement in revenue per labor hour.
However, revenue per labor hour does not tell the whole story. If the additional sales involve products with high ingredient costs, your gross profit per labor hour may not improve by the same percentage.
A more useful measure is:
Gross profit per labor hour = Gross profit / Total paid labor hours.
Using the earlier hypothetical figures:
Original:
$18,000 / 600 = $30.
Revised:
$20,100 / 600 = $33.50.
This helps you evaluate whether additional sales are genuinely improving labor productivity.
One idea worth testing this week is to identify your three busiest one-hour periods and compare their gross profit against scheduled labor hours. You may discover that one shift generates plenty of revenue but requires too many people, while another produces less revenue but has better contribution per labor hour.
Try three operational changes that expose hidden costs
Beyond reviewing your menu prices and payroll, there are several practical tests worth running.
1. Create a waste allowance for every major recipe
Do not use the same waste percentage for every ingredient.
Milk, espresso, syrups, pastries, and alternative milks have different handling and storage patterns.
Record the actual waste for a week, then compare it with the theoretical recipe cost.
If your latte should use $0.32 of milk but actual consumption indicates $0.48 per drink, investigate the difference before changing the selling price.
2. Run a slow-hour production experiment
Choose one consistently quiet period.
Prepare smaller quantities of pastries, batch ingredients, or other perishable products during that period.
Record how many units you prepare, sell, discount, and discard.
The goal is not simply to produce less. It is to match preparation more closely to demand without creating stockouts.
This can improve the amount of gross profit retained from inventory purchases.
3. Track the profit contribution of add-ons separately
For seven days, record sales of extra espresso shots, alternative milk upgrades, syrups, and pastries.
Calculate the additional revenue and direct product cost for each.
You may find that one popular add-on generates less profit than expected because of its ingredient cost or preparation time.
Use that information to adjust the recipe, portion, price, or placement.
These three tests can be completed with a spreadsheet, a recipe sheet, and daily sales reports. You do not need to redesign your entire menu to find useful information.
Use this weekly coffee shop margin checklist
Copy the following checklist into your weekly management routine.
- Update coffee bean, milk, syrup, and packaging purchase costs.
- Check the recipe cost of the five most frequently sold drinks.
- Measure milk discarded during preparation.
- Record expired pastries and other unsold food.
- Compare actual ingredient usage with theoretical recipe usage.
- Review average ticket by weekday.
- Identify the strongest and weakest sales periods.
- Compare transactions per hour with paid labor hours.
- Calculate gross profit per labor hour.
- Review add-on sales and their contribution.
- Check whether discounts and complimentary drinks are recorded correctly.
- Update monthly operating profit and operating profit margin.
Keep the checklist short enough that a manager can complete it consistently.
A weekly review is generally more useful than waiting until the end of the month to discover that milk costs, waste, or labor hours have moved in the wrong direction.
Use menu-level costing to make better decisions
You should not assume that your most popular drink is your most profitable drink.
A $5 latte may generate more gross profit dollars than a $3 drip coffee, but it also takes more preparation time.
A pastry may have an attractive ingredient margin but create losses through unsold inventory.
Review each menu item using three measures:
- Selling price.
- Gross profit dollars.
- Preparation time and operational complexity.
For example, consider two entirely hypothetical products:
| Measure | Latte | Drip coffee |
|---|---|---|
| Selling price | $5.00 | $3.00 |
| Direct product cost | $1.03 | $0.45 |
| Gross profit | $3.97 | $2.55 |
| Preparation time | 3 minutes | 1 minute |
| Gross profit per preparation minute | $1.32 | $2.55 |
The drip coffee generates less gross profit per sale, but more gross profit per preparation minute in this simplified example.
That does not mean you should remove lattes. It means you should understand what each product contributes to the operation.
A useful menu review considers demand, profit dollars, preparation time, and waste together.
Use CounterChef to connect recipes with sales performance
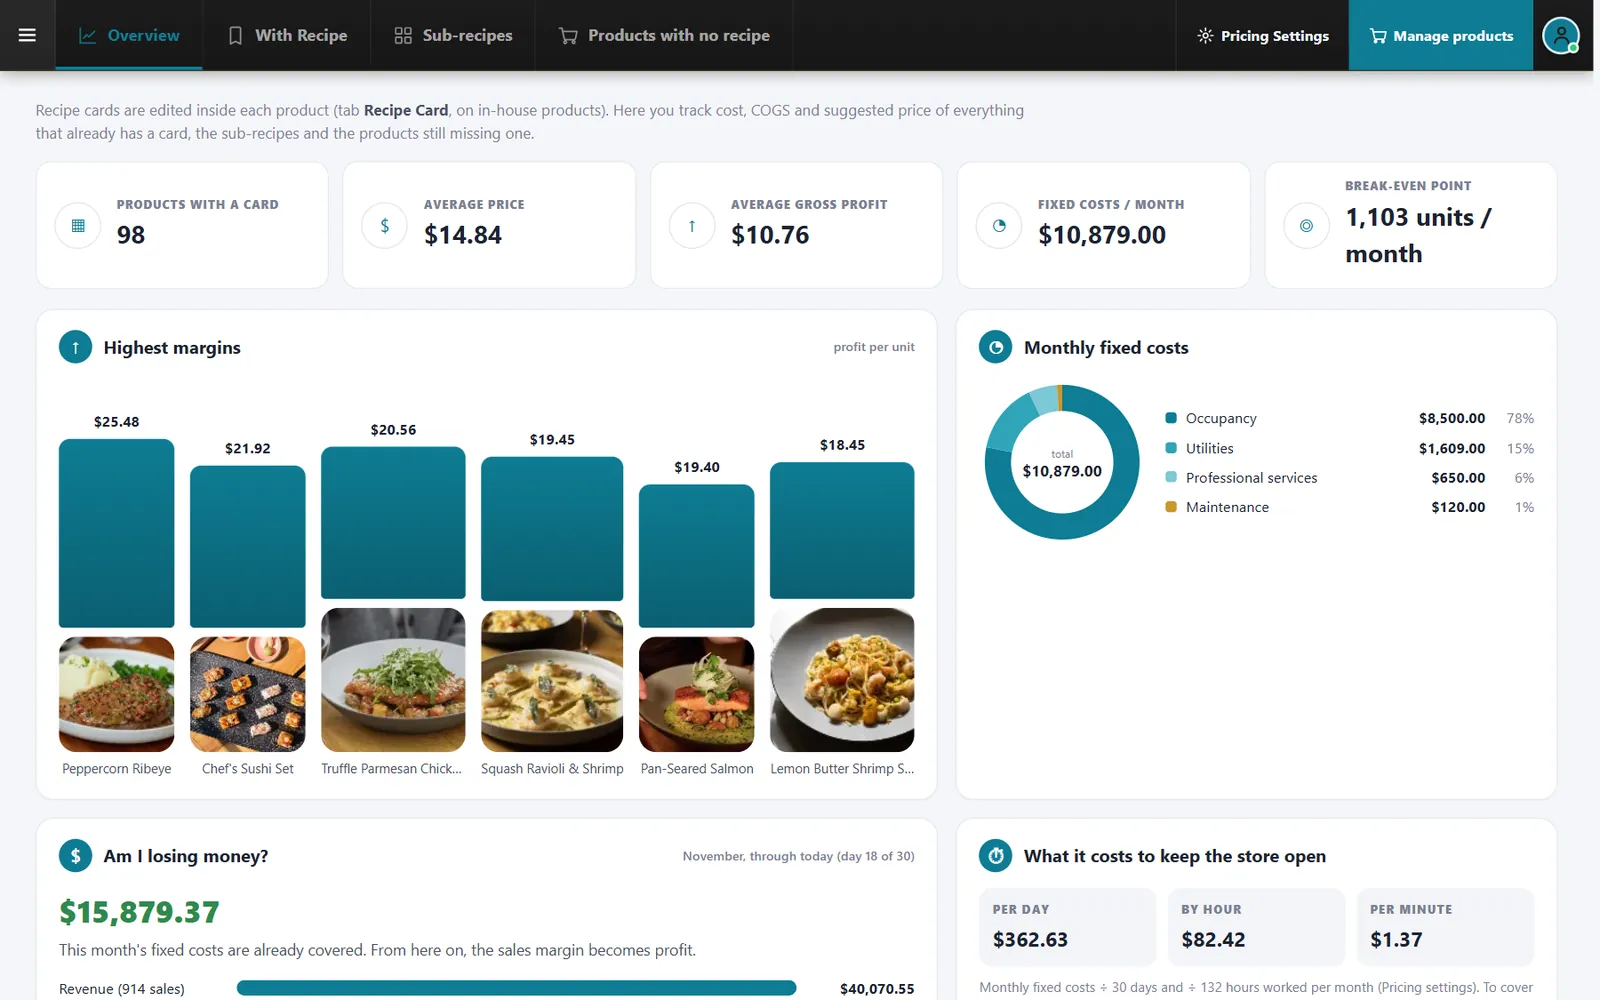
CounterChef recipe cards connect to menu items and show cost and gross profit. Its owner dashboard shows sales by weekday against the previous period.
These two capabilities can help owners review recipe economics alongside changes in weekday sales.
Frequently asked questions
What is a good coffee shop profit margin?
There is no single profit margin that works for every coffee shop.
A small takeaway operation, a full-service neighborhood café, and a specialty coffee shop with extensive food preparation have different rent, labor, equipment, and product costs.
Treat any published margin range as a rule of thumb that varies by concept, location, operating hours, and business model.
More importantly, compare your own monthly results over time and separate gross profit margin from operating and net profit margin.
How do I calculate coffee shop profit margin?
Start by subtracting your cost of goods sold from sales revenue.
Divide the result by sales revenue and multiply by 100.
For operating profit margin, subtract operating expenses as well before dividing by revenue.
For example, if hypothetical monthly sales are $20,000, COGS is $5,000, and operating expenses are $12,000:
($20,000 - $5,000 - $12,000) / $20,000 x 100 = 15%.
Your hypothetical operating profit margin is 15%.
Should labor be included in coffee shop food cost?
No. Keep direct product costs and labor separate when calculating gross profit margin.
Ingredients and packaging belong in COGS, while employee wages and applicable payroll costs belong in labor expenses.
You can allocate preparation labor to individual products for additional analysis, but avoid counting that labor twice when calculating overall operating profit.
How often should I review my coffee shop profit margin?
Review product costs and waste weekly, and calculate your full operating results monthly.
Update ingredient prices whenever suppliers change their prices or purchasing arrangements.
Review staffing hours alongside sales by hour, rather than waiting for monthly payroll totals.
The purpose is to catch small operational problems before they become recurring expenses. A latte that consistently uses too much milk, an afternoon shift with unnecessary coverage, or a pastry that regularly goes unsold can quietly reduce the money your coffee shop keeps.
Related feature: Recipe costing.